2. Technical
features and methodology
2.1
Computer application
There is an
easy to use and clearly useful computer programme which can be utilised both for the
organisation of observations and for the introduction and processing of data, as well as
for the drafting of reports based on the exportation of graphs manufactured directly by
the programme. This is a 32-bit application for Windows constructed from C++ and Visual
Basic, which takes up only 20 Mb of space in the hard disc.
2.2
General aspects
In general,
all Ofercat data is derived from data collection using sociolinguistic methods of
observation, and in fact four different techniques are combined: random route observation
of commercial premises and service sector companies, visits to organisations, telephone
calls and other observation.
Depending on
the district in question and its territorial setting, samples were selected of the
different organisations and random routes taken for the effecting of observations.
2.3
Random sampling
Statistical
samples are those constructed by random selection. Strategic samples are obtained when we
work in strategic areas or areas with a great concentration of commercial premises. Where
necessary, both methods were used in combination. With Ofercat, in the case of the samples
of commercial premises and service sector companies, we worked with a margin of error of +
5.
To calculate
the total number of routes, the number of commercial premises and service sector companies
in the sample for each area were divided, approximately, by 50 shops and companies per
route. Along these routes we observed identification labelling and informative labelling
in the shops and premises, the advertising in the street, and the signs.
The number of
routes was selected in the different areas of the town or city in question proportional to
the number of commercial premises per area, where we had this information, and in an even
distribution where we lacked such information. Specific routes were also selected going to
the shopping centres and the main covered markets.
2.4
Visits to organisations
In the
organisations visited we observed the two types of labelling: identificational and
informative. In the case of identificational notices, the main notice identifying each
office or premises was selected. In the case of information notices, the first three
notices of this type that were seen were included in the sample.
The number of
organisations (institutions, bodies and boards, associations and other organisations)
included in the sample, was determined in accordance with table 1.
Table
1. Number of organisations observed
To determine the number of offices, customer service points and organisations
(other than the shops and companies) that we were to observe, we were guided by the
following table: |
Total number of offices |
Number of offices to observe |
from
0 to 30 |
all |
from
31 to 50 |
30 |
from
51 to 100 |
50 |
more
than 100 |
70 |
2.5
Telephone calls
The initial
language of identification and the language of the subsequent response from the
interlocutor at the organisation were noted.
Initial
language: the language used by the person answering the telephone before asked any
question is made to them. To avoid ambivalent cases ("Si?" ("Yes"),
for example, which is the same in Spanish as in Catalan) or in the cases where nothing is
said, the caller would remain silent, to force the person to say something. Where nothing
is said, the telephone call was null and void, at least as far as the initial response
question was concerned.
Language
of Response: This is the language used by the interlocutor in response to the
question asked of them in Catalan.
Two types of
telephone call were made: those made to the sample of shops and service companies,
selected at random from the Yellow Pages, and those made to the other organisations. The
first were gathered according to the grid for telephone calls to shops and service sector
companies. In the second cases observers were supplied with a list featuring the telephone
number of the organisations to be telephoned (in most cases, these were the same
organisations that we visited personally, with the exception of the schools,which were not
telephoned.
2.6
Other observation
Other data was
collected by other than the above-mentioned methods. These included:
- Media with the
greatest print run or circulation of the various organisations
- The language of
the websites
- Specific random
routes: factory estates and shopping centres
- Written
communications sent to the service industries' customers - water, electricity, gas and
telephone.
- Tickets issued
by public transport
- Advertisements:
shops and surveys, and adventure playgrounds
- Church services
and ceremonies
- Local press (magazines,
television and radio)
- Language of education
2.7
Further information already included in the programme
These documents,
from centralised organisations, which are the same throughout Catalan territory, were
collected via the Ofercat Commission and, therefore, their results are included directly
in the computer programme.
3.
Main results
At
the present time we have the results of the pilot Ofercat trial
carried out in Santa Coloma de Gramenet [suburb with many residents
originally from outside Catalonia], and the first cycle of observations,
carried out in the towns and cities of Tremp, Manresa, Tarragona
and Lloret de Mar, and the Old City district (Ciutat Vella) in the
centre of Barcelona, during 2001.
Consequently, the
data we offer refer to the five cities and the district of Ciutat Vella was mostly
obtained in 2001, with the sole exception of Santa Coloma de Gramenet, which date from
1998. In spite of this time lapse, we preferred retaining the Santa Coloma data, given
that it is the only city in the inner ring of satellite towns for which we have data at
this moment.
At the same time
it should be noted that in 1998, in Santa Coloma, not as many observations were included
as in the standard version of Ofercat, and accordingly this result has to be taken
as provisional. However, the information we now have, gathered in 2003, of the same town,
which now includes a sufficient number of observations, indicates that the index we have
for Santa Coloma dating from 1998 constitutes a good approximation.
First of all we
will present the general indices, and move on to the results of each of the subsectors
and, lastly, we will present averaged figures for the main subsectors and ambits, and for
the district of Santa Coloma de Gramenet by factors.
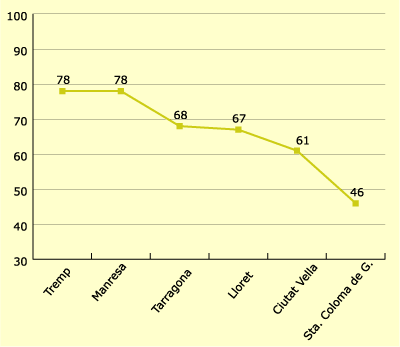
Figure 1.
Ofercat Results by towns

As the graph
shows, the availability of Catalan goes from a maximum value of 78 (in the case of Tremp
and Manresa), to a minimum of 46 (in the case of the Barcelona suburb Santa Coloma de
Gramenet). What we have here, therefore, is a rather marked step or range of 32, seen in
the distance that exists in terms of oral and written competence in Catalan, between one
place and another, according to the 1996 linguistic census. Thus, between the 89.36% of
the population who claim to speak Catalan in Tremp, and the 52.2% who claim to do so in
Santa Coloma de Gramenet, there is gap of 37.16 %; and between the 55.71% in the Manresa
sample who said they knew how to write it, and the 32.61% once again in Santa Coloma,
there is 23.10 % difference.
Even so, the
gradient is not even, but rather hints at different taxonomies, all related to the Catalan
availability factor. Clearly, the number of observations or sightings taken to date is
still very limited, and it is not possible to draw definite conclusions. We need to wait,
therefore, to get the results of the twenty-five towns and cities in the overall Ofercat
cycle. Nonetheless, what we have here is a group of populations where the availability of
Catalan is majority level (Tremp and Manresa), a group which is quite homogenous; an
intermediate group (Tarragona, Lloret and Ciutat Vella), definitely more disperse; and a
final downturn, to a "group" where we just have, at present, the results for
Santa Coloma de Gramenet.
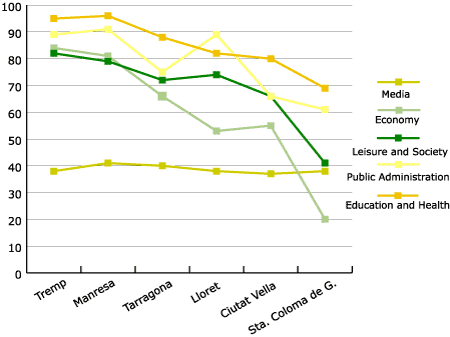
Figure
2. Ofercat results by sectors

But it is
necessary to go into finer detail, and observe the data by sectors as shown in figure 2.
If we calculate
tendencies, the sectors which, in most cases, have highest values (score highest) are
Public Administration and Education and Health; there is a second block with Leisure and
Society, and Economy; and lastly the Media. The only exception to this, in this scheme, is
that in Santa Coloma de Gramenet the Economy index or score is lower than the Media one,
although, as we indicated above, we have to some extent to take these data as provisional. |
