| Ofercat. Indicators of the availability of Catalan: An instrument at the service of language planning, by Mercč Romagosa, Pilar López and Albert Fabŕ | ||||
| CONTINUA |
What is very clearly observable, once again, is the trend of the lines between sectors, which show a pronounced down curve from Tremp to Santa Coloma, except in the case of the Media, which are much the same everywhere. This is logical and predictable, given that both in audio-visual media and the press, national level distribution predominates over the local or county level. In the same way, the difference between the sector with the highest score, and the lowest (the media excepted) is more accentuated as we go down. Thus, in Tremp, the gap between Education and Health on the one hand, at 95% and Society and Leisure, at 82% is 13%; in contrast, in Santa Coloma, between the 69% scored by Education and health, and the 20% for Economy there is a gap of...49%! Differentiating itself somewhat from these general tendencies, the coastal resort of Lloret de Mar shows an upturn for Public Administration, at a level above Education, and one in the opposite direction, owing to the more pronounced downturn for Economy. If we look at the Lloret de Mar data by subsectors or, by ambits, we can appreciate the dual nature of this locality in Girona province: it behaves like a very Catalanised town, on the one hand (with above average scores, for example for the Central Government Administration); but with quite low scores in different subsectors or ambits connected with the principal economic activity of the town, that of tourism, on the other. To take a closer look at this, we present figure 3, which shows the average indices in the different localities for the principal subsectors and ambits. We have added the Ofercat mean index for the six localities. Figure 3. Mean indices by subsectors and ambits, and Ofercat mean score
Here the range of scores is even wider, going from 97% for the Generalitat, to the 22 % for the non-daily press, a yawning difference of 75 percent. Local government offices and those of the Generalitat have the highest scores for presence of Catalan, greater in every case, than the Ofercat mean. The radio stations provide the most paradigmatic instance of this. They bolster the lower mean scores for the rest of the media; they are precisely the part of the media regulated by the Generalitat, while the rest of the media are regulated by central government (the Spanish state). However, it is important to note that Society also scores highly (76, to be exact). Turning to the subsectors and ambits that score below the mean, these show us where efforts should be concentrated in the future: Economy, Administration of justice and State administration, and the media with the exception of the radio. Figure 4. Ofercat 1998 results by factors at Santa Coloma de Gramenet Lastly, in figure 4, we show the results for the Barcelona satellite town of Santa Coloma de Gramenet, by factors.
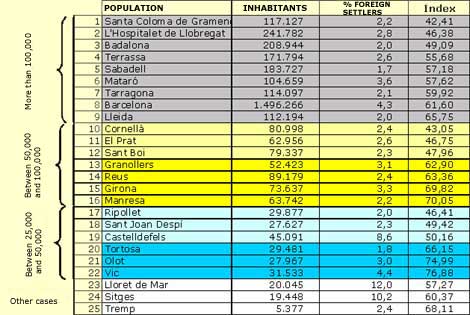
Here it is worthwhile noting the contrast between the language of oral identification and the language of oral convergence. In the first case, as we said above, a note was taken of the language in which the different organisations addressed their customers during the initial turn, while in the second case what was noted was the language used once the observer addressed them in Catalan. The fifteen percent difference between the first score and the second, in the instance of Santa Coloma, is only a nine or ten percent difference in the other areas, but always there is a substantial difference of this sort between the two figures: here, then we have the possibility of growth in this area, as important as it is for oral language use. 4. Evaluation and prospects for the future As we have seen, the territorial, multisectorial and multilevel object of Ofercat's object of analysis is innovative and is sufficiently flexible in its applicability to be applied to populations great and small, with very different socio-economic features, as the experimentation already carried out has shown. It enables us to analyse which are the stronger and weaker points of the supply of linguistic products and services in a given population and allows us to observe its evolution where Ofercat is used at regular intervals. One of its most notable formal features is the simplicity of the presentation of the results thus obtained: an index (or score) and a graph for each population gives us the information at a glance, clearly and specifically; but it also makes it possible for us to obtain 100 indices and graphs that enable us to observe a single ambit (commerce, or private healthcare, for example), or a subsector (leisure) or the index for identification labelling for the entire population. That is, we obtain with the exploitation of the results, amenable working material for linguistic planning, light in form, but solid in its contents. It is for that reason that Ofercat has the characteristics which make it suitable to be included in a stable programme of indicators which, looking to the future, will make it possible to obtain data in series as in the case of census data and voting lists. Thus we will be able to look at the evolution of knowledge of a language over time, and monitor the trends in the supply of Catalan in our towns and cities. It is also important to note that, if the project is obtaining samples that are sufficiently representative of Catalonia, we can obtain an overall picture of the supply of Catalan over the major part of the territory. Accordingly, we could propose a study involving 25 towns and cities. The towns and cities chosen would need to comply with the following criteria: 1. The universe is confined, in principle, to settlements of 25,000 habitants or more. 2. We add 3 settlements more, two chosen from those of 10,000 inhabitants or more, of which 10% or more are foreigners, and a third, Tremp, which formed part of the first round of field work. 3. We distribute these populations in six blocks:
To make the selection of towns and cities we bore in mind the demographic, territorial and sociolinguistic index factors, and the inclusion of the settlements that formed part of the original pilot study. As a result of the application of these criteria the following selection emerged:
Source: Voting lists for the year 2000. Percentage of foreign settlers according to the 1999 voting lists. Ofercat is such that it can be easily adapted to other territories where Catalan is spoken, with sufficient supervision. Another possibility to be considered, would be to take its development one step further and make Ofercat a tool of analysis for the servicing of a language other than Catalan, in another part of the world where more than one language coexist. people of different nationalities have contacted the Ofercat Commission to find out more about this possibility. This is a new and exciting challenge. Mercč
Romagosa |