 |
Figure 10. Uses of Catalan in a range of situations and linguistic
identity. 2000. Percentages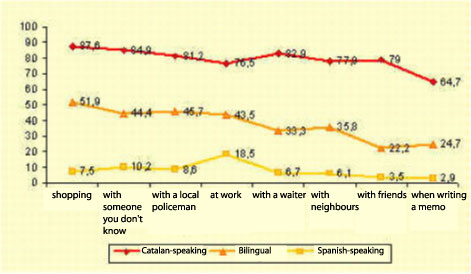 If we are to
interpret the diagram properly, we must remember that the data refers only to individuals
who state that they use Catalan, not Spanish or both languages. In other words, what
percentage of Catalan-speakers, bilingual individuals and Spanish-speakers state that they
use Catalan in these contexts. If we are to
interpret the diagram properly, we must remember that the data refers only to individuals
who state that they use Catalan, not Spanish or both languages. In other words, what
percentage of Catalan-speakers, bilingual individuals and Spanish-speakers state that they
use Catalan in these contexts.
Firstly, the line
structure is very similar to that of the general data: it is always used more often in
more impersonal and official situations than in others involving more personal contact.
The only case that might be worth discussing separately is use in the workplace. Here, we
see the highest values of Spanish-speakers and the lowest, paradoxically, of
Catalan-speakers. It is well-worth remembering that the former consider that knowledge of
Catalan makes it easier to find work. Albeit only in specific jobs, (related to
administration, teaching, healthcare, etc.), it would seem that this is the most
favourable context for using Catalan for those who do not consider it to be their
language.
Secondly, it is
evident here also that linguistic identity is one of the key elements explaining language
use. Catalan-speakers have values of between 76.5% and 87.6% (around 80%), whilst
bilingual individuals oscillate between 22.2% and 51.9% (a very important oscillation of
almost 30 points) and Spanish-speakers always have very low indices (with the exception of
the at work intersection point, with 18.5%).
Finally, written
usage is invariably lower than other data (except in the case of bilinguals, although the
difference is so small that it is not significant).
3. 2. The language of the last
non-domestic conversation
The survey asked
about the language used in the interviewee’s last, non-domestic conversation.
According to the fieldworkers, the interviewees stopped to think for a moment before
giving their answer. The data would therefore seem to be more related to "real"
facts than to the opinions of subjects on their use of Catalan.
The result is
entirely coherent with those of other surveys, indicating that non-domestic use of Catalan
in Catalonia is around 50%.
Now, let us take a
look at the intersection with linguistic identity.
Figure 11. Last
conversation in Catalan and linguistic identity. 2000. Percentages
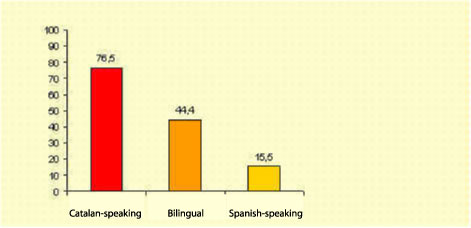
As we can see, this variable is strongly co-related with use, as we saw in Figure
10, although not entirely.
Thus, if we
consider the data from both diagrams, although the majority of Catalan-speakers use
Catalan, a minority (between 10 and 20%) do not use it so widely. The same occurs with
Spanish-speakers : although the majority use Spanish the most, between around 5 and 15%
use Catalan more. However, it all depends, clearly, on the context.
3. 3. Survey Language
We will end this
run-through on language use with data on the language in which surveys were conducted. The
protocol was very clear. Interviewers were to address the interviewee in Catalan and only
to change language if the interviewee did so first.
This data can tell
us what the use of Catalan in a favourable context would be, albeit a totally hypothetical
context. If all speakers established linguistic contact with a person who spoke to them at
the outset in Catalan, the result, in terms of the number of conversations in Catalan,
would be this figure. |