Sociolinguistic
characterisation of young people in Catalonia: some factors that
explain linguistic uses, per Anna Torrijos(1) |
||||
| CONTINUA |
The diagram also takes into account more current phenomena such as globalisation which, as we explain later on, acquire importance in explaining the linguistic uses of young people. Therefore, through the social changes involved in globalisation (new forms of relationships, immigration, new linguistic offer, etc.) the linguistic uses of young people are affected. We should point out that the linguistics uses considered here are set within the Catalan reality. In this sense, our prevailing interest is the use of Catalan and the use of Spanish. This is specified in young people who when they speak in any area or with any person use exclusively or mainly Catalan - to whom we refer as young Catalan speakers; young people who use Spanish exclusively or mainly -to whom we refer as young Spanish speakers, and young people who use both languages in differing degrees -young bilingual speakers. Therefore, it is in this sense that in this text we use the concepts of Catalan speakers and Spanish speakers, always referring to the use of one language or another. 4. The quantitative analysis: application of the logit model(9) The application of multi-variables techniques, in this case, hopes to account for what varies beyond the simple description of the date of the 2002 Survey on young people. The aim of applying the logit model is to identify the relationship between a dependent variable, linguistic uses of young people aged between 15 and 29, explained by a series of independent variables. The logit model is used when a causality relationship is considered. A variable is considered to be dependent and is explained by the rest of variables that are independent. The multinomial logit model (10) in question has the language of young Catalan people as dependent variable. In a multinomial logit model only the significant associations in which the response variable intervenes without the interaction of the explanatory variables is taken into account. Therefore, this technique is highly useful for explanatory models as when an influence is defined, it is not affected by the influence of the other variables of the model. Finally, to have a more complete model, two applications were made: in the first, the variable to be explained was the family language, and in the second, the variable to be explained was the habitual language. This article shows global conclusions. The synthesis variables included in the models are:(11)
The main results of these variables show that half young Catalan people have Spanish or mainly Spanish as their family language (49.6), 42.3% have Catalan or mainly Catalan as their family language and 7.1% speak both languages. As far as habitual language is concerned, 42% of the young people say they habitually use Spanish (only or mainly), 43.7% Catalan and 13.7% both languages. In addition, in the 2002 Survey on young people they were asked for their linguistic uses in other areas (see table 2). Overall, the uses of Catalan are more frequent at work/secondary school and when writing. Bilingual uses occur more frequently at work/secondary school and with strangers and the use of Spanish occurs more frequently in the family. It should be mentioned that the family is the area that is least bilingual and the area of friends is very bilingual. Table 2. Language spoken by young people in the various areas and written language
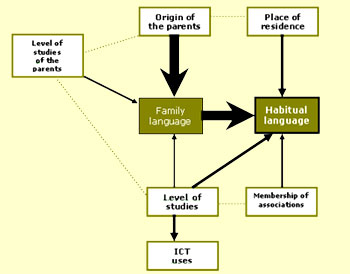
Source: 2002 Survey on Young People of Catalonia General Secretariat for Youth As far as the place of residence of the young people is concerned, 44.7% are from the metropolitan area, 22.5% live in Barcelona city and 32.9% in the rest of Catalonia. With regard to the level of studies of the person interviewed, it should be taken into consideration that many members of the group of young people are currently studying (45.4%). Of the rest, 21.9% have higher qualifications, 19.9% elementary studies and 11.8 medium level studies. With regard to the parents of the people interviewed, we should point out the greater frequency of young people with parents both of whom were born in Catalonia (39.4%), in second place, young people with parents both of whom were born in another part of Spain (31.8%), and in third place mixed couples, in other words, one of the members born in Catalonia and the other in another part of Spain (25.1%). With regard to the level of studies, most of the parents are couples without studies or with elementary studies (55.7%), in 22.7% of cases one of the members of the couple has higher qualifications and in 18.8% of cases, one of them has medium level studies and the other has elementary studies, or they both have medium level studies. Finally, it should be mentioned that 44.5% of young people are members of some kind of club or association. The most frequent ones are sports clubs. On the other hand, the use of new information and communication technologies created variable indicates that 53.2% of young people use 2 or more ICTs—such as mobile phone, computer or Internet. Description of the results of applying the logit model In the first place, it should be said that in both analyses (family language and habitual language) the model adapts to the data in a satisfactory way.(13) in addition, there are no relationships of more than two variables, therefore, the effects that are described are concerned with the relationship between the two variables that control the rest; they are direct effects and there are no combinations of two or more variables that influence the response variables. This kind of analysis accounts for the influence of one category of the independent variable (place of residence, origin of the parents, level of studies, etc.) on a category of the dependent variable or to be explained (family language and habitual language). In other words, that it shows how belonging to one category or to another influences the predisposition of having Catalan, Spanish or both languages as a habitual language. The following diagram shows the results of both analyses in a graphic way. The black arrows indicate the influence and the direction it takes; the thickness of the arrows indicates the intensity of the influence. The green dotted lines show the influences that have been explored with complimentary analyses but which are not part of the logit model because it only takes into account the influences directed at the dependent variable (family language and habitual language). Logit model diagram (variables that influence linguistic uses)
With regard to the model in which the dependent variable is the family language, we should state that the analysis confirms the hypothesis in which family language is explained by the origin of the parents in the first place, the educational level of the family nucleus in second place, and the educational level of the young person in third place. The strongest influence is the family origin. This means that, when the place of birth of the parents is outside Catalonia, Spanish prevails in linguistic use in the family; when the parents were born in Catalunya, Catalan prevails as the linguistic use in the family. This trend is also influenced by the level of studies of the parents and of the people interviewed. Thus, the higher the level of studies in the family linguistics uses, the greater the use of the Catalan language. Below you will see a table summarising the results of the application of the logit model for family language: Summary of the results of the logit model family language
- The identifier corresponds to the number assigned to the interaction.
The interaction is the combination of categories of the independent
variables with the dependent one. The absolute value of the parameters indicates the intensity of the association. Therefore, it is observed that the most intensive effect is that of parameter 53 and 56 corresponding to the family language and origin of the parents effect. In other words, there are differences in the family language depending on the place of birth of the parents. In the model in which the response variable is the habitual language, the family language is the one that determines, to a great degree, the habitual language of the person interviewed. Far behind this, the level of studies, the place of residence and membership of associations determines the habitual language. In addition, according to the resulting model, the variable that determines a frequency of ICT uses remains outside the model as, although it has an influence on the habitual language, this influence comes from its relationship with the level of studies and not on its own. Below you will see a table summarising the results of the application of the logit model for habitual language: Summary of the results of the logit model habitual language
In this case, it is observed that the most intense effect is that of parameters 82, 86, 85 and 83 corresponding to the effect of habitual language and family language. In other words, that there are differences in the habitual language depending on the family language. The four significant parameters have a positive sign and indicate that when the family language is Catalan, the willingness of young people to use Catalan habitually is greater (parameter 82). At the same time, we should mention the fact that young people whose family language is Catalan and Spanish are more likely to have Catalan rather than Spanish as their habitual language (parameter 83).
|
|||||||||||||||||||||||||||||||||||||||||||||||||||||||||||||||||||||||||||||||||||||||||||||||||||||||||||||||||||||||||||||||