| The Indexpla Applied to the City of Barcelona, by Montserrat Peitx | ||||
| CONTINUA |
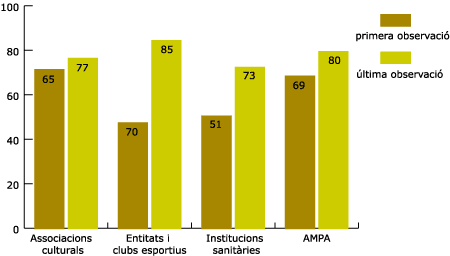
7.2. Health and Social institutions Figure 9. Health and Social institutions
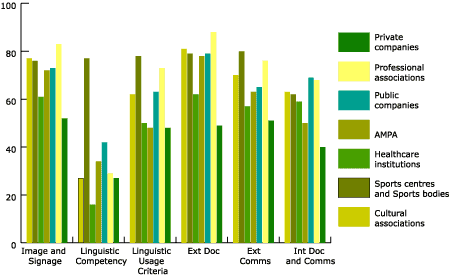
In the sub sectors of the ‘Health and social institutions’sector, the biggest differences were found between health institutions and the AMPAs (Parent and Student Associations). The AMPAs and cultural associations showed a similar growth between the first and last observations made, and sports centres grew by 15 points, continuing to appear in the highest band when compared with other sub sectors. The growth of 22 points amongst healthcare organisations is comparable to that shown by private companies, even though, in our opinion, the close contacts maintained by bodies in this sector with public organisations, made the initial ILN higher than that demonstrated by private companies. The Indexpla is based on a system of indicators, grouped by factors. Here is a brief description of each factor: 1. Image and Signage: this is the public image of the organisation. 2. Linguistic Competency of the Staff: this is the linguistic competency level of the staff. 3. Linguistic Usage Criteria: this refers to the adoption of linguistic usage criteria. 4. External Documentation: these are printed documents for external use. 5. External Communications: these are written and spoken texts used outside the organisation. 6. Internal Documentation and Communications: these are standard documents, and written and spoken communications used internally. Figure 10. Results by factors of all sub sectors
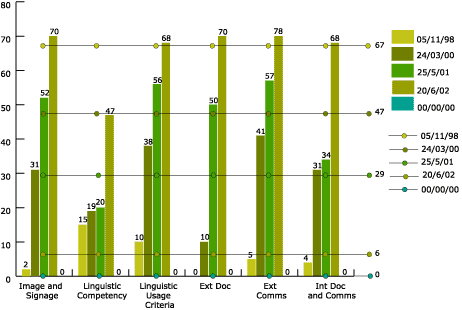
The results of the Index shown by factor, based on all of the organisations of each sub sector, demonstrate that those factors which imply relatively simple changes, (for example image, or external documentation and communications) and which depend directly on a decision taken by the management of an organisation, are easier to assume than those changes which affect the staff, such as linguistic competency. This factor is the one which shows the lowest index in all of the sectors we observed. It is also the index which is most difficult to raise, both because of the financial investment and the time on training that an organisation would need to spend, as well as because of the fact that changes in this area are observed only over the medium to long term, and not in the short term. Below is a comparison of the objectives and the actions planned in two organisations whose initial ILNs were very different: a) Analysis of an organisation with a low ILN Figure 11. Lacoma, Santolaya, Malet y Cornet, lawyers and economists
This is a suite of lawyers with a workforce of eight. It is a small company, as regards staff numbers. Economic and production factors are not relevant when measuring the Index of Linguistic Normalisation (ILN) of an organisation. The first Indexpla observation made, gave an ILN of 6%. Therefore, according to the index, this organisation is not able to attend to the public in Catalan. And any intervention should be focussed on achieving a substantial increase in the use of Catalan in all areas, from the identifying image of the company, to the linguistic competency of the staff, and also on establishing some linguistic criteria for both attending to the public and for written communications. The second time it was measured, the ILN had moved up here by 24 points. Those actions which give immediate results, such as those affecting the image factor and the translation and correction of documentation, were the factors which showed most growth. More time is needed to reflect on the progress of other factors such as linguistic competency and the application of linguistic usage criteria. By the third and fourth time the organisation was observed, we can see how those factors which needed more time to achieve the proposed objectives are reflected. To conclude, the increase of the ILN, from 6 points to 67 points by the fourth observation, was positively viewed, and a final observation was proposed at the end of the training process. We should like to stress that the staff training process is the action that requires most time to give satisfactory results, and is the one where most obstacles to linguistic change are often found. b) Analysis of an organisation with a very high ILN Figure 12. Indexplŕ '98
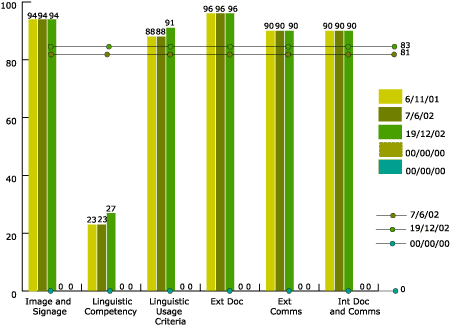
This is a service company that provides services for schools and leisure activities. It has a workforce of 22 workers. The first observation made for the linguistic plan gave an ILN of 81%. This shows that the level of Catalan achieved in the company is very high. In this example a linguistic autonomy protocol was devised. If we look at the six factors we can see that the company’s image, documentation and communications gave an ILN of approximately 90% at the initial observation. Linguistic competency however, showed the lowest index with just 23%. Obviously, with respect to the linguistic needs of the company, it only needed to undergo staff training. The other factors hardly needed any intervention at all, and the growth of linguistic competency alone nudged the overall ILN level up when considered and interrelated with the other factors. Only two further observations were made here, and despite the fact that the documentation revisions and other specific elements of the assessment were deemed concluded, there was very little variance demonstrated by the factors during these observations. If the competency level of the staff is to reach a stage where they can be considered linguistically autonomous, a longer training process is necessary and the company must encourage its staff to undergo further training. |