Figure 3. ILN by sector – First
observation
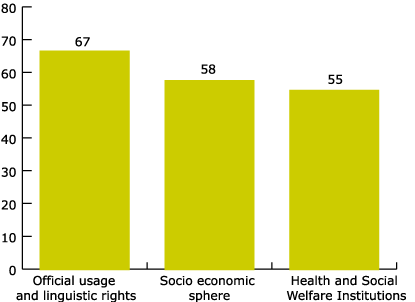
A study of the
first observations of those organisations belonging to the three priority sectors gives a
global ILN per sector. This index, done before measures designed to increase the
knowledge and use of Catalan were implemented, was higher in the sector which included the
Administration (the official usage and linguistic rights sector), and did not reach the
previously mentioned threshold in the other two sectors. The first comment that could be
made is to ask why, in the official usage sector, the initial global ILN does not reach a
higher percentage in the use of Catalan considering that the Administration was included
here. The fact that the legal sphere (lawyers’ offices, legal services etc) was also
included in this sector has influenced the outcome, not to mention the fact that there are
no agreements to encourage the use of Catalan in those public bodies where normal usage is
made of Catalan – other comments that might be made on this issue will have to be the
subject of another article.
6.
Analysis of the first observations by sub sector
6.1. Official
usage and linguistic rights
Figure 4.
Official usage and linguistic rights
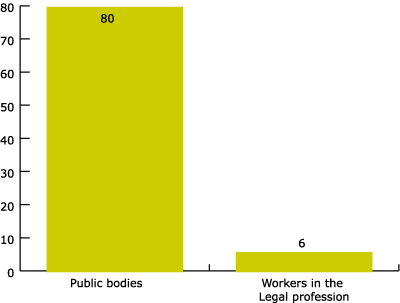
In the Official
usage and linguistic rights sector a significant difference was observed between the two
sub sectors which make it up. Those organisations linked to the Administration have an
average ILN of 81%; on the other hand, a lawyer’s office which belongs in this
sector, but is, nonetheless, a business, has an ILN of just 6%. Four observations were
made of the public bodies, and just one of workers in the legal profession.
6.2. Health
and Social Welfare Institutions
Figure 5. Health and Social Welfare
Institutions
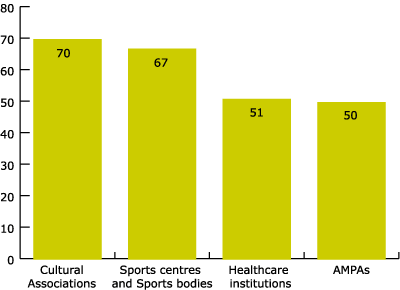
The Health and
Social Welfare Institutions sector, with an index below the threshold level (55), when
analysed by sub sectors, shows a difference of 20 points at either extreme. Those
healthcare institutions (hospitals, clinics, friendly associations etc.) where we have
worked and continue to work, demonstrate behaviour typical of businesses - very similar to
that displayed by the Private Companies sub sector.
6.3. The
Socio-Economic sphere
Figure 6.
The Socio-Economic sphere
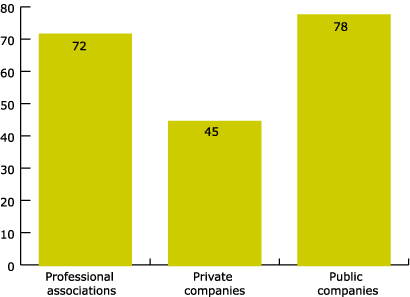
In the
Socio-Economic sphere there are two sub sectors that fall within the high ILN block, (they
are those that could be easily assimilated into public institutions - the Professional
associations and the Public companies).The Private companies, on the other hand, were 27
points below the Professional associations, and 33 points below the Public companies.
7.
First and last observations of all sectors
Figure 7. First and last observation by
sector
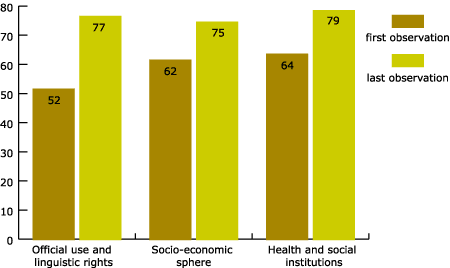
The bodies shown
in the graph are the subtotal of organisations where three or more observations have been
made, i.e. where they have been working to extend the use and knowledge of Catalan over
more than 2 years.
The ILN grew by a
similar extent in the ‘Socio-economic’ and in the ‘Health and Social
Welfare’ sectors (by about 15 points). And the area which showed the largest increase
was in organisations within the Official usage sphere. The ‘Socio-economic’ (and
related areas) sector is the one that showed slowest growth in achieving the set
objectives.
7.1. The
Socio-economic sphere
Figure 8.
The Socio-economic sphere
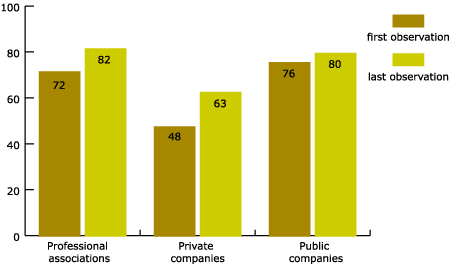
If we study the
ILN in the sub-sectors of this area, we can see how ‘Professional associations’
and ‘Public companies’ have grown by 10 and 14 points respectively, and have
achieved a high level in the use of Catalan. On the other hand, ‘Private
businesses’, which began with a very low ILN, has increased by 15 points and is now
on the threshold of normalisation. We can see that the higher the ILN to begin with, the
lower the relative growth - this behaviour is similar to that shown by the index of
knowledge of Catalan which has been observed in censuses and town hall registrations. |
