| Sociolingüística catalana |
| Uses and social
representations of languages in the Balearic Islands, by Ernest Querol |
||||
| CONTINUA |
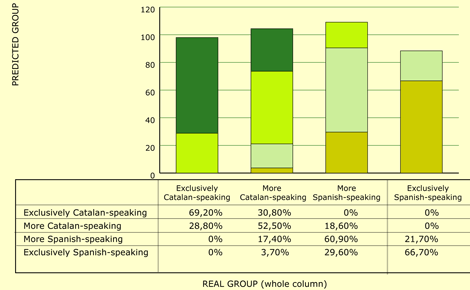
Figure 3. Correct results of the models
When the representation of Spanish and the Catalan network are taken into consideration, our theoretical proposal is able to correctly group 60.1% of classified cases. If we take a detailed look at the group, we see that, in the first group (exclusively Catalan-speaking), our theoretical variables proposal predicted 69.2% of cases correctly, in the second (more Catalan-speaking), it obtained 52.5% correct results, and in the third (more Spanish-speaking), it correctly grouped 60.9%. Lastly, for the fourth group (only Spanish-speaking), it obtained 66.7% correct results. This shows that the most successful predictions were obtained in the two groups at either extreme, whereas the least successful were obtained in the middle groups. Analysis of the correct results of the groups at either extreme reveals that not a single error is made in either case by classifying pupils in the two groups that are not immediately adjacent. Therefore, our proposal demarcates the groups well and only makes slight errors. Another, similar parallelism is observed in the two central groups: in no case is the wrong group at the extreme of the other language assigned, i.e. if we are classifying pupils who speak more Catalan, they are never mistakenly grouped with those who only speak Spanish. Or the other way round: if we are classifying pupils who speak more Spanish, they are never assigned the group that only speaks Catalan. The best-classified group is that of pupils who only speak Catalan, which is assigned correctly in 69.2% of cases. The percentage of grouping errors for those who speak more Catalan is 30.8%. The second best-classified group is that of pupils who only speak Spanish (66.7% correct results). In this case, the number of pupils classified in the adjacent group drops: 29.6% of errors. Here, one pupil is assigned (3.7%) to the group of more Catalan-speaking pupils. We can therefore conclude that the percentage of correct results is very high and that the errors almost always involve adjacent groups, except for one case which ‘jumps’ a group. 5.2.3 Predictions of Evolutions of Linguistic Groups On the basis of the data that we have obtained, our model can predict the evolution of linguistic groups by comparing the linguistic group to which speakers belong and that of reference. We have already confirmed that this prediction is successful with data obtained in Catalonia in 1993 (when we made proposals for future evolution) and 2000. Our present prediction can be seen in Figure 4. |
