| Sociolingüística catalana |
| The evolution of the uses and social representation of the languages in Catalonia (1993-2000), by Ernest Querol | ||||
| CONTINUA |
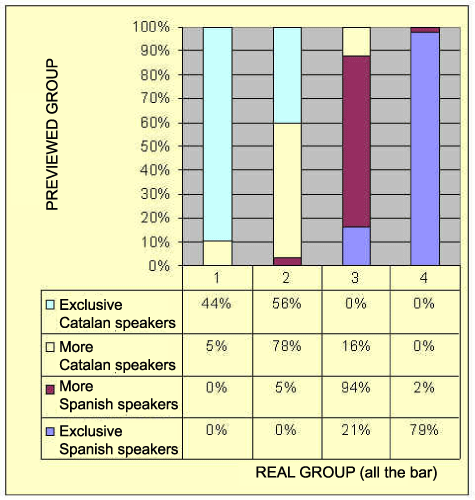
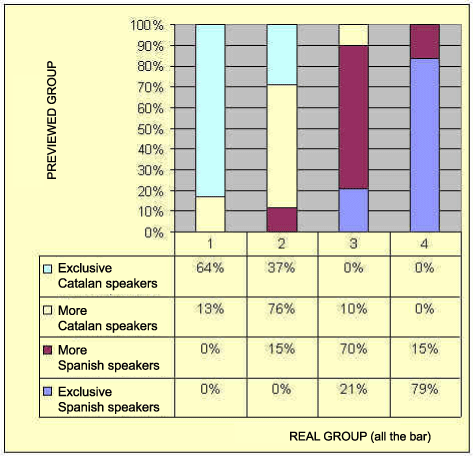
The table 7 (that we have divided in two parts so it can be seen better) shows us which are the segments that allow us to identify better each group (9). The first, in which the identity is "Spanish / not - Spanish". The second fact that divides the group is the auto-categorisation as a Catalan speaker / non Catalan speaker", together with the representation of Catalan. In the third level we will find the variables: Social Catalan net, representation of Catalan and representation of Spanish. As we see this method allows us to consider other variables as well as the ones proposed in the hypothesis (the identity "Spanish / not - Spanish" and the auto-categorisation as a "Catalan speaker / non Catalan speaker") and obviously we will find them in the most important places. In the table number 8, referring to the year 2000, we find once more the same three variables. Only in the third level, little changes are produced, like the one of the order in which the nets and representations appear. This fact shows us the stability of the characteristics from the linguistic groups. It is very interesting to compare the punctuation obtained in both researches because they show us the evolution of the linguistic groups, but, sadly, we don’t dispose of enough space to comment them know. 4.3.1. The predictions of belonging to a linguistic group The model that we have exposed allows us to preview the group in which the pupil belongs to without having the information that has taken us to do this classification (10). The one of 1993 previews an 83.8% of the classified cases, and in no way it does any mistakes with a group that is not neighbour. In year 2000, the level of right answers decreases in 72.3%, but it doesn’t do either any mistake that is not with a adjacent group, therefore, these elevated percentages show us the validity of the model that we have used. Let us see in tables 9 and 10. Table 9. Choice level (83.8%) of the model (1993)
|

