Discussion forum
Núm. 32 - september 2002


Editorial

Is there a climate change?
Josep Enric LLebot

Biological Symptoms of Climate Change
Josep Peñuelas

The Past is One of the Keys to the Future
Antoni Rossell

Resources for studying climate change in Catalonia: An historic view
Javier Martín Vide

Interview with Richard Lindzen
Lluis Reales

Environmental regulations


Editorial

Views on Climate Change

The Treaty on climate change was one of the main benefits of the Earth Summit in Rio de Janeiro. It springs to mind only a few weeks after the Johannesburg summit. This document gave birth to the Kyoto Protocol, in which the principle nations of the world became committed to reducing their greenhouse gas emissions.

The fact of the matter has shown us that it is very difficult to implement the Kyoto Protocol and that, within the European Union; some countries make efforts to do their duty -Germany and Great Britain- while others really don't apply themselves. The latter is the case of Spain. There are also sectors, such as transport, which do not contribute to the reduction of greenhouse gases.

It is precisely these gases, emitted into the atmosphere as a result of human activities, that contribute to climate change. The subject of this issue is two-dimensional. One dimension is political and economic, since the current model of production and consumption aggravates the socio-environmental problem, while the other is scientific. It is worth mentioning that all scientists agree that the climate is changing, but while some attribute much of the responsibility to human activities, others argue that the climate is always changing and that the 0.5-degree increase in the planet's temperature over the past hundred years has more to do with natural variability -water vapour and clouds- than with man-made CO2 emissions.

These are the diverse scientific views presented in this issue. The Chair of Physics at the Autonomous University of Barcelona (UAB), Josep Enric Llebot, gives us a review of the different attitudes towards climate change. Josep Peñuelas, researcher at the Centre de Recerca Ecològica i Aplicacions Forestals (CREAF) at the UAB explains how global warming is translating into significant modifications in the life cycles of plants and animals. The paleoclimatologist Antoni Rosell presents the main aspects of climate evolution over the past 500,000 years. Javier Martín Vide, Chair of Physical Geography at the University of Barcelona, goes over the tradition of studies on climate change carried out in Catalonia. These contributions are complemented by an interview with Richard Lindzen, Chair of Atmospheric Meteorology and Physics at MIT, Boston-Cambridge area. Professor Lindzen casts doubt on whether man-made greenhouse gas emissions contribute to climate change or not. A controversial perspective, no doubt. Finally, Ignasi Doñate analyses the Kyoto Protocol. Very different views, then, on a "hot" environmental problem.

Lluís Reales
Editor of Medi Ambient. Tecnologia i Cultura


Is there a climate change?
Josep Enric Llebot
Chair of Physics. Autonomous University of Barcelona. Member of the Institut d'Estudis Catalans (Institute of Catalan Studies)

Current thinking believes that human activities and today's life styles could notably alter the smooth running of planet Earth. The text looks at the scientific and socio-economic aspects of the controversy related to the climate. It wonders whether the climate really is changing, it reflects on the future and looks at whether the current situation is a threat or, in fact, an opportunity for new economic activities.

The Dawn, the Sun and the Moon and the climate change

In her book Relats de mitologia. Els déus (1), Maria Àngels Anglada tells us that Helios - the Sun, Eos - the Dawn, and Selene -the Moon were siblings. The Sun drove a divine quadriga; four winged horses, in a golden chariot that left the Ocean every day, in the east, crossed the vaults of heaven and went back into the sea in the west. The Sun was so lovely that there was not a nymph who refused to be his lover, and so he had a multitude of children. Phaëthon was the son of Helios and Clymene, a daughter of Oceanus. When he was an adolescent his father, on seeing him so handsome and strong, promised to grant him a wish, Phaëthon asked him to let him drive the Sun's chariot. Helios saw with concern that his son could not manage the quadriga, but a god could not go back on his word. The result was worse than even he had expected. Phaëthon knew nothing about how to drive and control the chariot of flames and in the wild path the four winged horses took him on, he dropped too close to the earth causing fires in the forests and drying up rivers and lakes. Zeus, finally, seeing the imprudent action of the runaway chariot, sent a saving thunderbolt, killing Phaëthon. This story from Greek mythology tells us, in a poetic and also exaggerated way, about the importance of the sun in the climate system. Two thousand years after this story was imagined, Melutin Milankovitch (2) suggests that the periodical variations of the characteristics of the orbit of the earth around the sun were the cause of climate changes in past eras, as if trying to justify, through the complicated compositions of heavenly mechanics, what was represented in classical times by the sun's chariot.

However, it was not until about seventeen years ago that we started to acquire a more or less generalised form of awareness of the consequences of human activities on the global behaviour of the atmosphere. Between autumn 1984 and spring 1985, articles by S. Chubachi (3) were published, corresponding to the observations at the Japanese base at Syowa, and by Farman, Gardiner and Shanklin (4) at the Halley Bay station, on the content of the stratosphere in the Antarctic. The two teams of atmospheric scientists showed that the content of ozone in the Antarctic stratosphere dropped spectacularly between September and October. The fact that this phenomenon was measured just above the continent that is furthest from the areas on the globe where the majority of pollutants are emitted, produced, initially, signs of scepticism, but soon after, once the measurements had been confirmed and the phenomenon had been understood, it caused great concern. For the first time there was evidence of a global environmental problem: the emission into the northern hemisphere of chemical compounds known generically as CFCs used in numerous consumer and industrial applications were spreading throughout the atmosphere until they reached the stratosphere, and in the Antarctic where, in spring, the low temperatures and the dynamics of the atmosphere produced complex chains of chemical reactions, they ended up eliminating the stratospheric ozone.

As a result of the scientific discovery and the importance of the problem, numerous groups of scientists from around the world started to research the problem. There was a great amount of activity and numerous congresses and meetings were held to discuss and present the results of the latest pieces of research. One point worth mentioning is that despite the fact that the phenomenon had been measured with scientific instruments at the time, there had already been information available from satellites on the levels of ozone in the Antarctic, for some years, but nobody had studied it. At the same time, given the global dimension of the problem, the political representatives of the governments of the countries met under the auspices of the UN, to act against the problem and what we know today is that they reached an agreement to limit the production and consumption of the chemical compounds that were causing the problem, signing the 1987 Montreal Protocol, which was extended, according to the increase in knowledge of the problem, in later agreements. As a result of this, we can now say that the problem of the stratospheric ozone is fairly well known from the scientific point of view, and that politically there are international agreements that have been drawn up with the aim of alleviating the problem.

Therefore, the role that the fast irruption of the ozone problem had on public opinion is a paradigm: since then, there has been a change in the social conception of environmental problems and their scope. Although there is still a more direct perception of the local dimension of many environmental problems, the possibility that human activities could significantly alter the function of the planet is present in current thinking.

While the conversations that led to the Montreal Protocol were taking place, the World Meteorological Organisation and the UN were preparing the setting up of the Intergovernmental Panel on Climate Change (commonly known as the IPCC). The IPCC was finally constituted in 1988, and since then it has been an important reference point as far as scientific knowledge is concerned, as well as the impacts of the climate change and of the actions of adaptation and mitigation regarding this phenomenon. Therefore, in some ways, the IPCC represents the opinion of the experts on the climate change associated with human activities, their impacts and possible strategies of mitigation and adaptation. The IPCC reports are used by those who are politically responsible as a reference point for discussion and the eventual drawing up of international treaties that try to deal with the problem of the climate change.

When we talk about climate change today, we refer to the climate change on earth related to the effects of the emissions into the atmosphere of certain gases that are produced as a result of the activities of modern society. It does not refer to the climate changes that have occurred throughout the geological history of the earth, although knowledge of them is an important tool for getting to know the current climate and its development. It is also known as global warming, as the warming of the atmosphere is the first effect that the greater presence of greenhouse gases in the atmosphere seems to be producing. In this article, we intend to give a brief summary of the current state of the problem, basing it on a series of questions. The controversy associated with the climate change due to human activity has two aspects that are mutually related: the scientific and the socio-economic and political aspects. Traditionally, there was great emphasis on the first, as what was needed was to get to know the problem and its implications well, but at the same time as suggesting the actions to be taken it entered straight into the social, economic and political dimensions of our world that represent the starting point for any solution.

The beginnings: what is the climate and what do we understand by climate change?

An intuitive definition what the climate is, can be resumed by saying that it is the average weather, in other words, an average of the most important meteorological variables that characterise meteorology: temperature, rainfall, humidity, etc. On defining a time average, however, we must state the periods of time for which it is calculated: days, weeks, months or years. Meteorology, therefore, corresponds to knowledge of instantaneous weather, in other words, the behaviour of the atmosphere for a period of less than ten days, whilst climatology studies the average behaviour of the climatic system on time scales that are greater than ten days, but that are normally seasonal averages, or yearly ones or even averages for longer periods of time. In fact, it is precisely this characteristic of climatology, regarding the knowledge of the average weather that has meant that, until very recently, it has not been a discipline of interest in the scientific community (5).

If we take a look at recent history, the first person to talk in the current sense about the question of climate change was Svante Arrhenius(6), a Swedish physical chemist awarded the Nobel Prize, who in 1896 presented the Physics Society of Stockholm with a document in which he argued that a reduction or an increase of 40% in the concentration of carbon dioxide, a gas present in very small concentrations in the atmosphere, could provoke disturbances in the function of the climate which would explain the advance or withdrawal of the ice fields. Arrhenius formulated a model that was simple but that calculated the reflection of the radiation by the earth's surface and by the clouds or the retroactions produced by the layer of ice and snow in such a way that, taking into account current knowledge, we now consider it to be naive or even maybe mistaken. Arrhenius (7) concluded that the variation of the CO2 content and of the water vapour of the atmosphere has a great influence on the energetic balance of the climate system. He reached this conclusion after carrying out calculations without the help of any mechanical instruments, or obviously, electric ones and he did between 10,000 and 100,000 operations by hand, corresponding to what we know today as different aspects of CO2 emissions. He also carried out calculations for the four seasons of the year and tried to discriminate the effects of the increase of CO2 depending on latitude. In the conclusions to his work, we can read "...if the quantity of carbon increases in geometric progression, the temperature will increase in arithmetical progression". Arrhenius also worked out that the variation in temperature would be greater in relation to a greater quantity of carbon dioxide, that temperature would increase more if the latitude was greater and in addition, that the increase would be greater in winter than in summer. Overall, Arrhenius worked out that if the atmospheric content of CO2 doubled, there would be an increase in temperature of between five and six degrees Celsius.

Luck and chance meant that Arrhenius' predictions are very similar, from a quantitative point of view, to the results obtained by current sophisticated climate models. Probably, the consideration of the Swedish scientist as the person who started the study of the climate change, is also due to this similarity. However, Arrhenius would share an advanced vision with current experts, as he did not just talk about the effects of the increase of carbon dioxide on the physical system, but also about its environmental impacts. His positivist view of progress together with the perspective of a person who lived in a country subjected to the rigours of a long, hard winter would have made him think about the positive impact of a less rigorous climate that would probably facilitate the movement of certain agricultural practices to higher altitudes, alleviating, to a degree, the deficit of food at that time.

If we take a huge leap in time, research into climatology during the first half of the 20th century was of interest to few scientists. It was only after the development of the automatic weather forecasting systems during the second half of the 20th century and particularly during the last quarter of the century, that people started to think about methodologies for predicting the climate. The climate system was defined in a document drawn up by the GARP (Global Atmospheric Research Programme) of the World Meteorological Organisation in 1975, as the system formed by the atmosphere, the hydrosphere, the cryosphere, the lithosphere and the biosphere8. Later, the framework convention of the United Nations on the climate change, signed in Rio de Janeiro in 1992, which was also mythical because of its environmental matters, and that started functioning in March 1994, defined the climate system as the atmosphere, the hydrosphere, the biosphere and the geosphere and their interactions. Whilst both definitions are obviously very similar, the second emphasises the interactions. The atmosphere, the sun, the oceans, the surface of the water, the surface of the ice and snow and the set of plant life and other living beings in the ocean and the continents, are closely related to each other, exchanging energy flows and material, which makes it difficult to achieve a complete understanding of its function.

We also often assess the climate in an excessively simple way, asking ourselves how the temperature or the level of the sea will change. The answers that we try to give from the perspective of the climate model however, are also related to more social aspects of housing and of sustainability answering questions such as "Will we be able to breathe the air"?, "Will there be enough water for drinking and for agriculture?", "Will the environment be comfortable enough?". To be able to answer these questions, we do not only need to know the function of the climate system but also to draw up scenarios of development of the socio-economic system, in other words, to clearly establish the relations between the climate system and human society.

The concentration in the atmosphere of the gases that cause the greenhouse effect increase and as a result of this, is the climate changing?

The common characteristic of the gases that cause the greenhouse effect is their ability to absorb long-wave radiation emitted by the Earth. The number of these gases is very great. However, in practice the ones that are analysed in detail, given their radiational significance, are just six. On the whole, the emissions of these gases are increasing, although there are some that are decreasing. Apart from water vapour, of the greenhouse gases that are most directly influenced by human activity, the most important ones are carbon dioxide, methane, ozone, nitrous oxide, sulphur hexafluoride and chlorofluorocarbons (CFCs). Other atmospheric components that also need to be taken into consideration are aerosols, particles in suspension in the atmosphere, of different sizes, of a natural origin and products of combustion, the role of which is not totally clear in climate development. On the whole, the emissions of gases and of aerosols into the atmosphere grow in relation to the growth of the economy. Economic wellbeing traditionally leads to high emission rates, and, on the other hand, economic crises are characterised by fewer emissions.
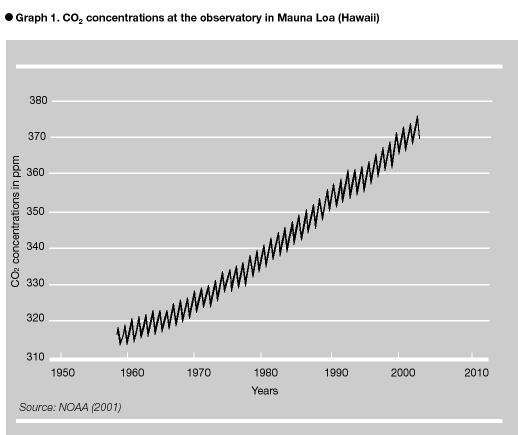
Carbon dioxide in the atmosphere, for example, has been measured since 1958, when an observatory was installed in Mauna Loa, in Hawaii, an instrument that since then has continually registered the content of this gas in the atmosphere. If you look at the Keeling curve in figure 1, you will see that without a doubt, the amount of carbon dioxide in the atmosphere increases year after year. This trend is common in the case of most of the gases that are responsible for the greenhouse effect, which currently have concentrations in the atmosphere that are greater than in pre-industrial times (9).

Therefore, the fact that most greenhouse gases increase thanks to human activities is not questionable. However, there is some uncertainty about where all the CO2 emitted into the atmosphere actually goes, as the amount that is measured in the atmosphere is approximately half the amount that is emitted into it. Nor is it totally clear what the global effect of aerosols is, in particular sulphates and soot. It is thought that their ability to reflect solar radiation creates a softening effect of the greenhouse effect, as they act as a shield from the sun's radiation. It has also been observed that the rate of growth of emissions is decreasing, in other words, it is not growing as was expected. This could be the result of the transformation of many systems of electrical energy production, of the transformation that goes from the use of coal to other fossil fuels with fewer carbon emissions and to the transformations of certain agricultural, stockbreeding and industrial practices.

To be able to affirm that the climate is changing, we need to refer to the study of data from the networks of stations that measure the temperature of the earth. The instrumental register of the temperature in earth stations and in boats, leads us to conclude that the global surface temperature of the air increased by between 0.4 º and 0.8 ºC during the 20th century. The trend of warming is general throughout the planet and is consistent with the retreat of ice fields, the reduction of the snow area and the faster rhythm of the increase in the level of the sea during the 20th century compared 
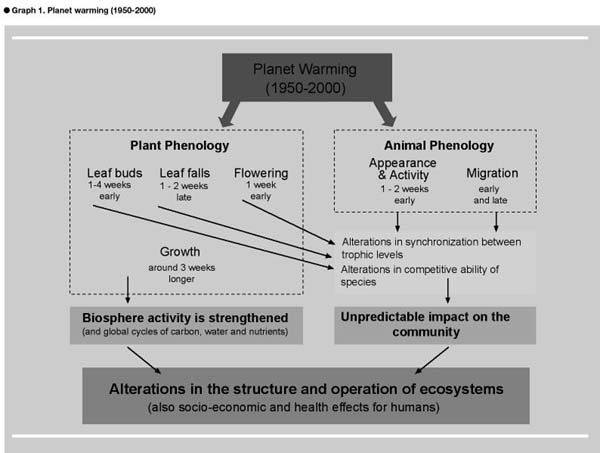
to the last thousand years, for example. Phenomena derived from the warming that, corresponding to biological systems, means an integration of the changes of different climate variables, such as the lengthening of the period of growth in some plant species, the earlier flowering and the later falling of leaves, the northward movement of some species of butterflies and towards higher areas of some species of trees and the arrival before expected of some migratory species, have been observed and documented. It also seems that we can confirm that the surface water of the ocean has heated by 0.05 ºC over the last fifty years.

The most significant changes, however, were produced in the Polar Regions, especially in the northern hemisphere. The analysis of data provided by the declassified information from Russian and North American submarines, show that the ice in the Arctic has become thinner since the middle of the 1970s. Information from satellites also shows that the concentration of ice over the Arctic in the summer has reduced by about ten percent. In the same way, the variation of the temperature has not been uniform throughout the whole globe, nor for all the years. The greatest warming occurred before 1940 and after 1980 to the end of the century. However, the northern hemisphere experienced a slight cooling between 1946-75 and there are areas in which this cooling was very evident, especially in the east of the American continent.

The reasons for this interruption in the warming are not clear. One possible explanation is the increase in aerosols, which we mentioned earlier, as a result of the use of coal as a fuel with a high sulphur content. To these, we can also add natural causes, such as the variation of the luminosity of the sun 
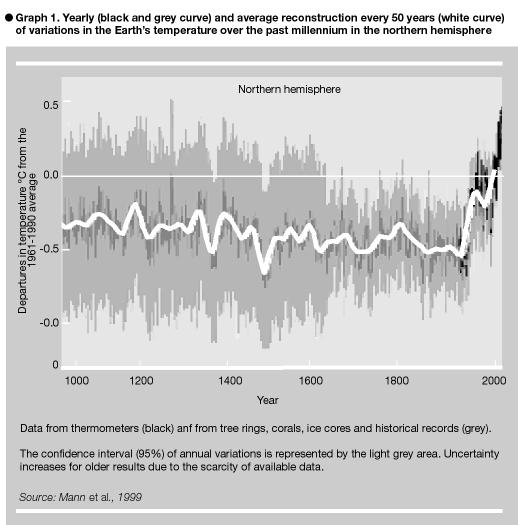
or volcanic eruptions that took place during this time.

The IPCC report10 compares the average warming produced during the 20th century with other disturbances in the climate from the past. To make this comparison, they use instrumental data that covers the last two hundred years, together with assimilated data that comes from the analysis of the rings of trees and the study of air bubbles in the ice in Greenland. The results of the analysis show that the warming we experienced in the 20th century was probably one of the greatest in the last millennium. However, this statement must be interpreted with care: the best data available has been used but it is irregular in its distribution over time and space and therefore the degree of confidence it provides in the statement above is relatively small.

Another question is to find out whether the change in temperature is due to human causes or not. The aforementioned IPCC report, attributes, with a high level of confidence, the reason for the warming to the growth of the atmospheric content of greenhouse gases, and in addition, it shows simulations of numerical models which have managed to separate, over the last ten years, the natural variability and the variability related to human activities that are, obviously, very significant. Critics of these statements show, and not without reason, that there is still a great degree of uncertainty in the knowledge of the magnitude of the natural variability. It is said that by doubling the amount of carbon dioxide in the atmosphere there would be a radiational forcing of 4 wm-2 (of 2% with regard to the total radiation that reaches the surface), a quantity that is very small compared to the effect that the connection between the warming and the content of water vapour from the atmosphere and cloud cover could have. Therefore, they sustain that up until now it has been impossible to relate the climate change observed to anthropogenic emissions, as there is a lack of precise knowledge of the natural variability.
To sum up, it would seem that the data confirms that a change in the climate has been detected for which the increase in the atmospheric concentration of greenhouse gases is probably responsible, as a result of the generalised use of fossil fuels and the spark-ignition engine, of the development of agriculture and of intensive stockbreeding and of the changes in land use. Although over recent years, there has been a significant improvement in the mathematical models that represent the climate, there is still a certain degree of uncertainty about the anthropic contribution and the natural variability of the climate change.

How much and in what way will the climate change during the 21st century?

To be able to project for the near future about what the magnitude of the climate change will be, requires on the one hand, knowing with a good deal of confidence the function of the physical environment, in other words, having a reliable model, and on the other hand, being able to project with precision what the future emissions of greenhouse gases will be, and what the development of the carbon sinks, in other words, how the use of the land, agricultural and stockbreeding practices, forestry, etc. will change in the future.

Whilst we currently have fairly reliable models, as far as the knowledge that includes the functioning of the physical environment is concerned, the second aspect, the emissions and the development of the carbon sinks, is a challenge that has many imprecise aspects. In fact, the emissions have, up until now, been related to variables of a current economic and demographic nature linked to previsions that enable us to have a view of the development of the world economy over the next ten, twenty or fifty years. However, we do not know what the structure of energy production, industry or transport of societies in the future will be. These uncertainties are, therefore, too important to consider the results that are obtained from the models as predictions on which the future climate can be based.

To be able to compare the different models, the IPCC has drawn up future emissions scenarios based on forecasts made by the World Bank or the UN on demographic growth and world economy. These scenarios contemplate a wide range of assumptions on future economy and technological development. There is no need to mention the huge number of uncertainties that exist regarding economic growth, lifestyles, the use of different ways of producing energy, the growth of the population or future technological changes. It is based on these scenarios, and in particular on average forecast scenarios, that the graphs mentioned below should be understood.

A useful scenario to use is the one that assumes a growth of emissions over the next 20 years of 1% a year and that stipulates that until 2050, the emissions of greenhouse gases will be established at current levels. In the current context, it is as if we were considering a minimum situation. In this scenario, the temperature would increase by 0.75 ºC in 2050.

If we take into account the scenarios used by the IPCC, it envisages that in 2100, the temperature of the atmosphere will have increased by between 1.4 ºC and 5.8 ºC, which would be the greatest warming over the last 10,000 years. In addition, all the models say that the difference between the minimum temperatures and the maximum temperatures would decrease and that, on the whole, the minimum temperatures would be higher, thus reducing periods of extreme cold. On the whole, it is also thought that the rainfall would increase, although its distribution over time and space would be different. In our country, for example, it would seem that rainfall would increase in the winter, however, in the summer, on the other hand, periods of drought would be more intense and frequent. The models also envisage a general decrease in the area covered by snow and ice, as well as an increase in the level of the sea, mainly due to the dilation of water as a result of the warming, of between 0.09 and 0.88 metres. This general behaviour should not make us believe that everything will change in a uniform way or in the same way. The climate variability we mentioned above is not just a manifestation in time but also according to regions. There is proof of the co-existence in past times and within a few hundred kilometres distance, of opposed trends of natural variation of the climate. This fact is also the case in climate disturbances of an anthropic origin.

In a short period of time, agriculture and the forests would benefit from the fertilisation of carbon dioxide and the increase in the temperature and the rainfall. Regional studies are scarce and still not very conclusive. Nor is there a univocal trend for all kinds of crops and activities. The optimum conditions for some crops would change and, often, significant adaptations would be needed at regional levels. In the same way, the relation between the time scale of the regional climate change and the time that is characteristic of the evolution and adaptation of the species would be important. The effects on pests and plant diseases of the climate change are not completely understood and therefore, on a regional scale, and long-term, there is still a great deal of uncertainty and a lot more studies are needed.

Some models project the trend, in semi-dry regions, towards an increase in periods of drought. It seems likely that the amount of snow on the mountains would decrease and that the snow would melt as a result of the atmospheric warming, which could affect the water balance and important aspects associated with the availability of fresh water. At the same time, the increase of rainfall in the winter, and the hypothetical increase of periods of heavy storms could produce problems in controlling floods and changes in the habitats of plants and animals.

Another important aspect to be considered is the impact on health. The increase in temperature would, without a doubt, influence the frequency and transmission of infectious diseases, the effect on the population of heat waves and cold spells and obviously on the air and water quality. However, the guidelines these changes could produce are unknown. The variations of the temperature and the rainfall would lead to changes in the habitats of the organisms that act as vectors transmitting diseases (mosquitoes, rodents, etc.) It would seem likely, that if there were a lower frequency of certain cold spells, certain types of mosquito could survive, that under current conditions do not do so. Some studies envisage a possible incidence of the malaria mosquito in the south of the Iberian Peninsula within 10 years because of this. The same can be said about the impact of heat waves and cold spells. Cold spells would have fewer effects, as they would be less frequent, whilst there would probably be more periods of extreme heat, which could produce health problems in people who are particularly sensitive.
The increase of extreme meteorological episodes would seem to be another result of the climate change, given the greater quantity of energy in the atmosphere. This is also one of the most controversial aspects, as up until now a determined trend has not been discovered, from an instrumental point of view. However, a large part of the world's population is concentrated in coastal areas, which leads to envisaging important economic impacts if the level of the sea is higher or if there is a greater frequency of extreme meteorological episodes.

In any case, the weather is an important factor. Each of the above-mentioned processes has its own dynamics and in no case is it felt that there will be abrupt processes or changes. The adaptation of the natural systems to environmental changes could be gradual and the success or failure, or the vulnerability or sensitivity of a system will depend on the time it needs to adapt to the changing environmental conditions. Not all the changes will be negative. As Arrhenius forecast, the changes in the environmental conditions will be favourable for some processes and unfavourable for others. For example, whilst the changes of climate in the Mediterranean region could have a negative effect on the productive cultivation of certain cereals in a negative way, on the other hand, it will probably favour the growth of vines and olive trees, which are crops of great importance at the moment.
Is there a sustainable concentration of greenhouse gases in the atmosphere?

This means answering the question of whether there is a threshold concentration of greenhouse gases in the atmosphere, above which there would be catastrophic changes in the function of the climate system or whether we are sufficiently aware of the consequences of warming due to the increase of greenhouse gases in such a way that the scientific community is able to define an acceptable 
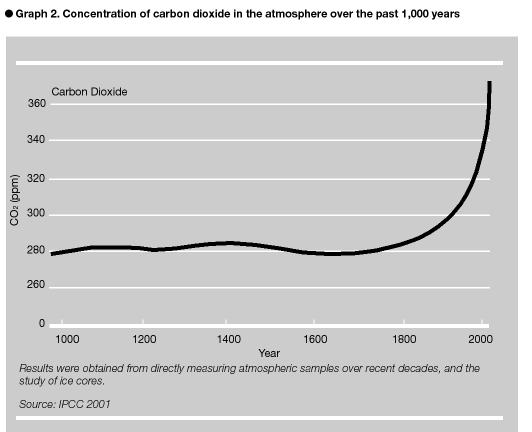
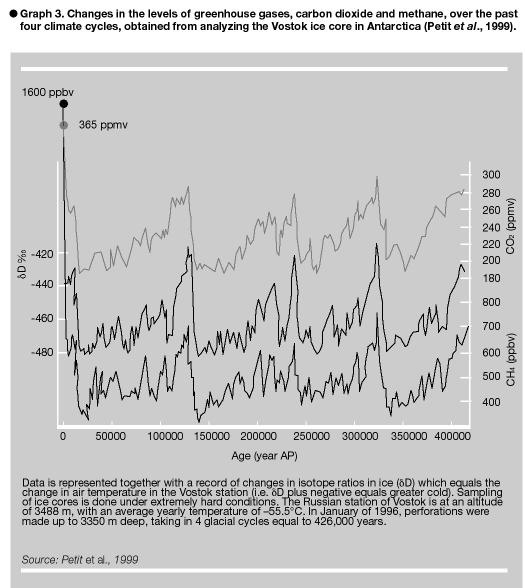
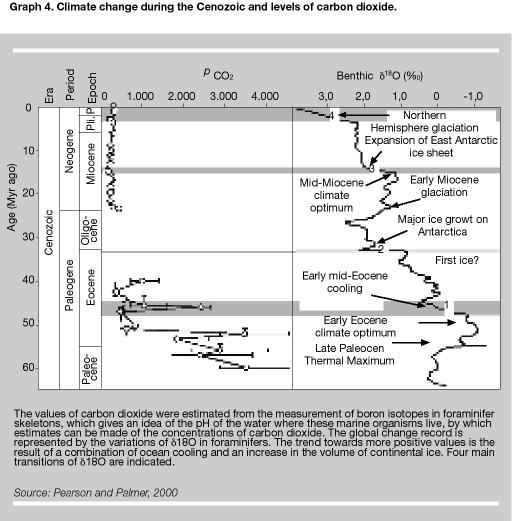
concentration based on the analysis of potential risks and damages.

One way of answering these questions is to observe what has happened in the past. Palaeoclimatology offers data about the variation of atmospheric CO2 during past periods of time in the geological history of the earth. About fifty million years ago there was between three and nine times more carbon dioxide in the atmosphere and it would seem that it was much hotter than it is now. For example, it would seem that there was abundant life in the Polar Circle or that the temperature of deep water in the sea was high. In addition, periods with sudden variations over thousands of years of atmospheric carbon dioxide have been found, also related to changes in temperature. Of these oscillations, there are some in which the hot periods exceeded the magnitude of the most radical projections of climate models. These changes are sometimes associated with the extinction or redistribution of species, but in no case with a complete disappearance of the biosphere.

The development of the future climate will depend on the nature of climate forcing, in other words, of the content of the greenhouse gases and the sensitivity of the climate system. Therefore, determining a sustainable concentration of greenhouse gases depends on the capacity to determine the sensitivity of the climate system as well as the exact knowledge of the factors of the forcing, and of risks and vulnerabilities. In addition, as has already been mentioned, the climate would change with a marked regional character and whilst all the models envisage a global increase in the temperature and rainfall, their distribution in time and space vary from area to area of the globe and from model to model. Therefore, with the knowledge we currently have of the climate system, it is difficult, if not actually impossible, to establish an atmospheric concentration of greenhouse gases in which the risks and impacts are related in a balanced way to the technological and economic efforts to achieve it.

In addition, the latter factors are not uniform for everyone. The problem with the climate change is different depending on whether one sees it from the perspective of a city in the European Union or the United States, with good technological and economic ability to adapt to changes, or from the point of view of an Eskimo who depends on the ice field for his food, or an inhabitant of the Maldives, a set of 1600 coral islands, for whom the extension of his country depends on the rising of the sea level.

Therefore, considering a realistic and pragmatic point of view, the action when faced with climate change includes two kinds of fundamental actions: the mitigation of the causes and the adaptation to the new climatic conditions. The mitigation consists of decreasing the emissions: it is clear that under current conditions, the technology is available for stabilising the atmospheric content of carbon dioxide to 450 ppm, 600 ppm or 1000 ppm. Defining the level is a question of an economic nature and of political and social desires. With regard to the adaptation, this means preparing for the changing conditions, from the point of view of economic activities, with the adaptation of infrastructures, etc. Both strategies, adaptation and mitigation, will be vital in order to alleviate the phenomenon.

The only international agreement on reducing emissions that has been made to date, the Kyoto Protocol, still waiting to be ratified, establishes commitments that are the results of agreements between states, the ones that make up the so-called appendix B, that questions the technological ability to reduce emission and adapt itself to the economic cost this would involve. There are no scientific considerations for the reduction proposals, or what amounts to the same thing, the scientific recommendations were far removed from the ceiling of the reductions proposed. Greenhouse gases remain in the atmosphere for a long time, in other words, they degrade with difficulty. This means that the actions that are taken will have long-term effects, over tens or hundreds of years. This is an important coincidence with other environmental problems, such as the degradation of the stratospheric ozone content to which we referred at the beginning of the article. The time scale of the origin of the disturbance is very much smaller than the time scale for the system to recover. Therefore, it is important to apply the precautionary principle, which consists in acting now, although there are still no complete certainties about the magnitude and scope of the phenomenon. What we do know, however, is that any action will have to be maintained for a long time and that it will come into effect far beyond our generation. This is a complication that is added to the management of the problem.

Climate change, an opportunity for new economic activities?

To be effective, the actions for alleviating climate change must be economically feasible but there are also new business sectors that are currently starting to develop as a result of the actions of mitigation and adaptation, which hope to become economically feasible. The development of these sectors would be a good tool for reducing the problem of climate change. Examples of these sectors are the companies dedicated to the development of alternative energy, such as the renewable ones, mainly wind and solar, or ones that work on the use of hydrogen as a fuel, and that study methods of generation and storage or develop fuel batteries or even those that are making renewed efforts to rekindle the generation of nuclear energy.

There are also incipient economic sectors linked to the reduction of emissions, such as the actions of buying and managing forests. In fact, forests and plants exchange huge amounts of CO2 with the atmosphere. Plants collect CO2 through photosynthesis and when they breathe, they release oxygen and a part of the absorbed CO2 . As a whole they retain carbon in the form of organic matter. The storage of carbon by plants is increasing as a result of the practice of reforestation or as a result of the changes in crop waste management practices. In Catalonia, and in many other developed countries, abandoning agricultural areas has, on many occasions, led to their transformation into forest areas, with the corresponding fixing of atmospheric carbon. The management of these and other areas in third countries subject to being managed, precisely for their ability to retain carbon dioxide, can represent a business opportunity if an international emissions market is finally established.
The activity in the emissions market, both from the point of view of acting immediately between the companies buying the emissions rights and the companies that can sell them, and the companies that wish to deal in certifications, in other words, to account for the emissions that are saved through a certain technological action or investment seems to be a sector that will develop with a certain impetus over forthcoming years. The trading of emissions essentially consists of being able to trade emissions that are not being made or emissions that are below the amounts previously established or agreed to. It is an attempt to achieve a decrease, as far as possible, of the emission of greenhouse gases into the atmosphere with the smallest global cost. Thus, if an industry or company, to be able to comply with its commitments, finds it very expensive economically or technologically to change a certain line of production for another with fewer emissions, it can negotiate to buy surplus rights of emission from another company. Globally, the atmosphere would benefit as though the company had carried out the work, and both the buying company and the selling company would obtain economic improvements thanks to the deal.

We have talked a great deal about carbon sinks and about the trading of emissions as alternatives to the reduction of emissions, especially within the framework of the Kyoto Protocol. The difficulties regarding its use, are not so much knowing whether they will really be useful for absorbing or retaining carbon dioxide, but concern the ability and the confidence of having systems for measuring and checking the quantities of carbon dioxide absorbed or not emitted. Only if this point is resolved, will the mechanisms for reducing emissions, that are so tame for some, the only ones possible for others, be able to be put into operation, and then actions will be started on the greenhouse gases in the atmosphere.

Conclusion

The attempt to offer a panoramic, brief view of some of the points that characterise the analysis of the possible climate changes, should not hide the fact that there are still considerable areas in which important questions are being made in which we need to improve knowledge and foster research into it. On the one hand, we need to maintain and increase the observational network and promote the development of studies that reconstruct the climate of the past as indispensable elements for understanding its current variation. We still need to understand, both globally and locally, what the contribution of the natural variability and of the anthropic variability is to the climate changes, which would lead to an improvement in the models and predictions at a local level. Thus, the incorporation of clouds and a precise knowledge of the carbon, water and nitrogen cycles would also improve the capacity to predict climatology. However, there will still be a lack of ability to predict the future socio-economic growth of our societies that, after all, is the essential element for being able to predict the development of the future climate. Despite all these elements, in no way can we adopt a hopeful attitude. The problem exists and we need to act on it as quickly and effectively as possible. The advantage is that most actions that intervene to alleviate the problem of greenhouse gas emissions into the atmosphere are actions that, in absolute terms, manage the resources better. In fact, improving the efficiency, using renewable energies, correctly managing agricultural and stockbreeding activities are examples of actions that reduce the emissions, but in absolute terms, even if the problem of climate change did not exist, it would be positive to carry them out.


References

1 - Maria Àngels Anglada: Relats de mitologia. Els déus. Edicions Destino, Barcelona, (1996)
2 - A. Berger, Milankovith theory and climate Reviews of Geophysics 26, 624-657, (1988)
3 - S. Chubachi, Preliminary result of ozone observation at Syowa Station from February 1982 to January 1983 Mem. Natl. Inst. Polar res., 34, 13-19, (1984)
4 - J.C.Farman, B.G. Gardiner, and J.D.Shanklin, Large losses of total ozone in Antarctica reveal seasonal CLOx/NOx interaction Nature 315 207-210, (1985)
5 - Llebot, J.E. El canvi climàtic Rubes 1998
6 - Llebot J.E. Svante Arrhenius: els albors del canvi climàtic en Medi ambient. Tecnologia i cultura: Onze referències del pensament ambiental, Barcelona 2001
7 - S. Arrhenius, On the influence of carbonic acid in the air upon the temperature of the ground Philosophical Magazine, 41 237-76, 1896
8 - Peixoto José P. y Oort A.H. Physics of climate AIP, 1989
9 - In the case of CFCs, this statement makes no sense as the first synthesis of one of these gases was in 1928, and most of them were developed and used during the second half of the 20th century.
10 - IPCC, Climatic Change 2001, The Scientific Basis, Cambridge University Press, Cambridge


Biological Symptoms of Climate Change
Josep Peñuelas
Ecophysiology Unit of CSIC-CREAF, CREAF (Centre for Ecological Research and Forestry Applications), Universitat Autònoma de Barcelona

Scientific evidence of the changes in the life cycles of living organisms has become a clear symptom that the climate change is affecting life. The author describes the phenological changes on a world scale, how communities are changing and the activities of the ecosystems and the biosphere. It also gives a special description of the situation in Catalonia.


We're warming up…

Planet Earth has warmed up over the last few decades. Now almost all of us know this. The average increase has been 0.6-0.7ºC, but in many places in Catalonia, the increase has exceeded 1ºC (1-5). This may well be the clearest symptom that the planet's biogeochemical activity is increasing. We all know as well what the most probable reason is. The population of one of its species, the human, and the use this species makes of resources and energy in its exosomatic activities, such as transportation and industry, have continued to grow exponentially. As a result, a whole series of changes of a global nature have taken place and continue to take place, one of which -a noticeable one due to its effects on organisms and ecosystems- is this warming (1)

As a consequence of the absorption of infrared radiation due to greenhouse gases such as CO2 or methane, and of its continued increase, almost all models forecast an accentuation of this warming in the coming decades. Last year, hundreds of climatologists, ecologists, economists, geographers, chemists, lawyers and other professionals, among which this author is included, generated the third report of the Intergovernmental Panel on Climate Change (IPCC 2001) 2 sponsored by the UN, and some of the conclusions reached merit attention. Evidence of the warming of the Earth and of other changes in the climate system are now even clearer and more conclusive than those included in the second report (IPCC 1995). The past two decades were the warmest of the past millennium. The frozen surface of the Arctic decreased by 15% over 50 years; the level of the sea has risen 15 cm over the past century; the precipitation regime has changed in certain regions and there has been an increase in the frequency and intensity of some phenomena such as "el Niño". All these changes seem to have become accentuated over the past few decades, because the atmosphere continues to change as a result of our activity, which, as we mentioned, grows exponentially and continues to be based on the combustion of fossil fuels. Predictions are for an increase of 1 to 5°C during this century, depending on the evolution of greenhouse gas emissions.

…and in Catalonia, what's more, we're drying up.

In Catalonia, the average temperature in many places has increased more than 1º C over the past 50 years, and it seems that the "good weather" arrives earlier. The temperatures registered in early April 50 years ago are now registered in early March (3). In some places, such as the central Pyrenees, average temperature increases for months like October over the past twenty years were truly extraordinary, reaching an almost unbelievable 4ºC. Despite the fact that precipitation did not decrease over the last few decades (3,4), the increase in temperature causes greater evapotranspiration, so that many Mediterranean towns and regions are now warmer and dryer than they were in previous decades. In the Roquetes observatory in the 20th century, potential evapotranspiration increased 13 mm and relative humidity decreased 0.85% per decade (4). Even though climate predictions, especially those related to precipitation, are highly complex on a local and regional level, the 1-3°C increase in temperature predicted for many global circulation models in the Mediterranean region for the mid-21st century will increase the evapotranspiration even further.

Life cycles are changing…

More things we all know. Our activity, and the activity of all living organisms, is strongly influenced by temperature. We cannot expect anything other than alterations of this activity. We cannot be surprised then by the fact that this warming has translated into significant changes in the life cycles of plants and animals (5). We must remember that passage through different phases depends, among other things, on accumulated temperature, on what we biologists call degrees-day, which is the total energy required by an organism in order to develop and go from one stage to another of its life cycle. Evidence of these alterations in life cycles in easily seen by those who follow nature and have a few years behind them. In fact, descriptions have been given in various regions throughout the world, from cold and damp ecosystems to warm, dry ones, just by observing available phenological records. These phenological changes (phenology is the science that studies the life cycles of organisms) have become the clearest symptom that climate change already affects life.
Catalonia is one of the places where the changes observed are most significant (3). However, observations such as those found here are also found with comparable results throughout the world, although there is a predomination of wealthy countries, with a greater number of researchers and a greater scientific tradition (5). Here in Catalonia, trees come into leaf an average of 20 days earlier now. For example, apple, elm and fig trees seem to come into leaf a full month earlier, and almonds and poplars about 15 days earlier. Others, such as chestnut trees, seem immune to the change in temperature (they must depend more on other factors, such as the photoperiod or availability of water). On the other hand, plants are also flowering and giving fruit an average of 10 days earlier than they did 30 years ago. The life cycles of animals are also altered. For example, the appearance of insects, which go through their different larval stages more quickly in response to the warming, is 11 days earlier. Butterfly lovers will have noticed. Butterflies appear earlier and are more active. All this premature plant and animal activity can place them in danger due to late frosts. Yet the frequency of these frosts has changed also, decreasing in this ever-warmer atmosphere. For example, in Cardedeu there were in the order of 60 frosts a year fifty years ago, and they now see in the order of 20, therefore the risk of young leaves and flowers spoiling has also decreased. In the sea as well, increases have been observed in the duration and abundance of phytoplankton in areas where there has been a progressive warming of the water between 1948 and 1995 5.

…with alterations in communities…

All these changes are not simple indicators of climate change. They have critical ecological significance because they affect the competitive ability of different species, their preservation and, therefore, the structure and operation of ecosystems.

Because nature is not homogeneous, responses to warming are different, depending on the species (and even on individuals). For example, alder and broom flower over a month early; poppies do so two weeks early, holm oaks one week; olive trees are unchanged while umbrella pines even take a few days longer. These heterogeneous responses to climate change can produce significant losses in synchronization of interaction among species, for example plants and their pollinators, or between plants and their herbivores, thereby altering the structure of communities.

A paradigm of this lack of synchronization among trophic levels is found in migratory birds. Climate change also seems to alter their habits. Given the early flowering and fructification of plants and the appearance of insects -and, therefore, the early availability of food for birds- one would expect an earlier arrival of migratory birds. Nevertheless, the arrival of such common and popular birds as the nightingale, swallow, cuckoo and quail seems to be delayed on average of two weeks compared to thirty years ago. This delay is surely determined by climate change in the place they depart from, the sub-Saharan regions, or in the regions they cross on their migration routes. Therefore, the drought and deforestation in Sahel, and the resulting lack of food, could make preparations for their trip difficult, favouring this delayed arrival. All these changes could mean a threat to some migratory birds that arrive at an inappropriate time to make use of the habitat they already have to share with species that, having stayed over the winter, find themselves in better competitive form. In fact, the decline in the number of these migratory birds arriving in Europe in recent years could be one consequence. On the other hand, there are species that used to migrate but now take advantage of the fact that our winter is increasingly mild, and do not leave the peninsula. This is the case of the hoopoe and stork.

… and in the activity of ecosystems and the biosphere.

When we look at phenological changes on a global scale (), we find such significant alterations as a 20% increase in the biological activity of our planet over the past 30 years, due in large part to the lengthening of the productive period. We notice it in images from Earth observation satellites as well as in data on atmospheric CO2 concentrations. To follow up plant masses from space, a standard plant index is used, the NDVI. This index is based on the quotient between infrared radiation and the red reflected toward space by the Earth's surface. The bigger the quotient, the bigger the green biomass. Therefore, this NDVI corroborates the phenological data from land observers and shows how, over the past 20 years, the plant-growing season has lengthened 18 days in Eurasia, which translates into an increase in green biomass, at least in latitudes over 40º. The increase in plant productivity over the last few decades, which we attributed to the fertilizing effect of CO2 and to nitrogen deposits, could also be due in part to this increase in temperature and to this lengthening of the growing season (plant activity).

All this is also corroborated by data on atmospheric CO2 concentration, which shows an increase in the seasonal oscillation of CO2 in recent decades, due to the greater reduction in spring of CO2 concentrations. This lengthening of the growing season plays a very important role in the global carbon fixing, the amount of CO2 in the atmosphere and in the water and nutrient cycles. Therefore, it has highly significant consequences in the operation of ecosystems, and in the C balance, which is now so important, in light of the Kyoto Protocol.

Other changes in our ecosystems

Mediterranean ecosystems have high climatic variability, significant topographic complexity, marked gradients in the use of land and availability of water and great biodiversity. Certainly due to all of this, they are especially sensitive to atmospheric and climatic changes, as well as to changes in land use, demographics and economics.

Climate change increases hydric stress in its vegetation, which is often already living at the limit of its possibilities, as is the case with some holm oak and pine groves having evapotranspiration rates equal to precipitation rates. In addition to accentuating the scarce availability of water, warming accentuates other features that are characteristic of our ecosystems, such as forest fires and volatile organic compound emissions.

Drought, fire, emission of volatile organic compounds and nitrates into water

We have a recent example of the effects of hot, dry periods in the hot, dry year of 1994. This period profoundly affected Mediterranean vegetation. The holm oaks, for example, dried up in many places, and they did so to a greater or lesser extent depending on the type and depth of the soil, as well as the orientation of slopes (6). Isotopic studies with C13 and N15 showed that these holm oaks continued to be affected in subsequent years, to the point that they used less water than that which was available to them, which in turn favoured the loss of nutrients in the soil, a serious secondary consequence when bearing in mind the fact that these ecosystems tend to be limited by nutrients.

These warmer, more arid conditions, together with other phenomena relating to Global Change, such as the increase in biomass and inflammability associated with the increase of CO2, and changes in land use -such as abandonment of farmland followed by a process of forestation and accumulation of fuel- increase the frequency and intensity of forest fires. Fires, which have increased throughout the 20th century (4), now constitute one of the most important disturbances in Mediterranean ecosystems (7). Given the complexity of the vegetation-fire relationship, effects on vegetation are predictable enough. For example, an increase in the number of fires increases the expansion of sun-loving species that do not tolerate shade and require open spaces. Contrarily, the presence of shade plants diminishes, and fires end up maintaining communities in successive early stages (7).

The increase in temperature also exponentially increases the emission of volatile organic compounds, which significantly affects atmospheric chemicals and the climate by means of the formation of ozone and aerosols or the oxidation of methane (8). Emissions are a result of the spreading of VOCs in a vapour pressure gradient coming from tissues with a high concentration into the surrounding air, where concentrations are low due to the high reactivity of VOCs. Therefore, emissions are controlled by factors that alter tissue concentration, vapour pressure or resistance to diffusion into the atmosphere. Temperature exponentially increases the emission of these VOCs by activating their enzymatic synthesis and their vapour pressure, and by reducing resistance to the emission. On the other hand, drought reduces emissions as a result of the lack of carbohydrates and ATP, and of the reduced permeability of the cuticle to gaseous exchange. Therefore, the end result of this antagonism between warming and drought remains to be seen in something as environmentally important as the biogenic emission of VOCs.

We must remember that biogeochemical processes depend on temperature. One of the processes that concern many Catalan counties is the progressive eutrophication, or enrichment in nutrients -especially nitrates- in well water. In many cases, this is linked to an excess of liquid manure, yet the increase in temperature, or droughts, is not entirely extraneous to this phenomenon. Warming increases mineralization, and drought prevents the use of nutrients by plants and facilitates losses in the system when rains do arrive. Another example of biogeochemical alteration is found in the stimulation of decomposition through heating. The lack of water, contrarily, slows it down. Studies should be carried out on the balance of the interaction of these two factors on the cycle of material and the way our Mediterranean ecosystems function.

Changes in Structure, Migrations, Desertification.

All these functional changes can end up affecting the structure of ecosystems. On a long-term basis, and if bad droughts, such as the one in 1994, are repeated often, important changes may be produced in the composition and structure of Mediterranean woods. Mock-privets, for example, could end up replacing holm oaks in a dryer, warmer climate, since they are more efficient in the use of water, in eliminating excess radiation and in hydraulic conductivity when water availability is low (9).

The bad drought of 1994 severely damaged many woods and thickets on the Iberian Peninsula (80% of the 190 peninsular towns studied showed damaged species). The level of impact was different depending on the functional type and evolutionary history of the different species (10). The Mediterranean genera Lavandula, Erica, Genista, Cistus and Rosmarinus, most of which are shrubs evolving under the climatic conditions of the Mediterranean -in other words, following the 3.2 million years of Pliocene Epoch- were apparently more affected by the drought than genera that had evolved earlier, including Pistacia, Olea, Juniperus, Pinus and Quercus, chiefly trees. Even so, Mediterranean genera recover much better following a few years of greater availability of water. Allochthonous genera such as the Eucalyptus were badly damaged by the drought, and did not recover in later years. Post-Pliocene Mediterranean genera seem to be better adapted to respond to an environment that is not easily predictable, having high seasonal and inter-annual variability and being subject to frequent disturbances. It is important to understand these responses in order to forecast the future composition of communities should the climate change continue.

To what point do Mediterranean plants and animals have the ability to adapt themselves or quickly condition themselves to these climate changes? From an evolutionary point of view, species tend to be fairly conservative, responding to disturbances more through migration than through evolution. In mountains, species can respond to climate change by vertically migrating over short distances (for example, 500 m is enough to offset a 3°C increase).

The planet and Catalan regions have already experienced numerous movements in plant formations, in the distribution of biomes in response to past climate changes. As yet, however, there is not much evidence in response to current warming. It is worth remembering that these processes require time. At any rate, this author and Martí Boada 11 recently compared the distribution of vegetation in the Montseny today with that of 1945, and we noticed a progressive replacement of temperate ecosystems (beechwood groves) by Mediterranean ecosystems (holm oak groves). Furthermore, beech woods have moved about 70 meters higher, reaching maximum altitudes (1600-1700 m). Heath land is also being replaced by holm oaks at middle altitudes, so holm oaks can be found at such unexpected heights as 1400 m. The progressively warmer, more arid conditions, but also the changes in land use -mainly abandonment of traditional management, such as the practical disappearance of fires associated with ranching (fires are now prohibited in the Montseny reserve)- are at the heart of these changes, in a paradigm of how different components of global change interact.

Paleo-ecological studies suggest that many plant species could migrate quickly enough to adapt to climate change, but only if there are undisturbed ecosystems nearby, which reminds us of the importance of the fragmentation of natural ecosystems as another factor in global change. Fragmentation is high in many areas of Catalonia. One only has to look at an aerial photograph of the counties of Barcelona. In regard to mountains, migration towards greater altitudes involves a concomitant reduction in the total area of each habitat, whereby species requiring a greater area could become extinct.

We should not be surprised by these effects of warming, because we all know that climatic regimes determine the distribution of species and biomes by means of the specific thresholds for each species in relation to temperature and water availability. This is not only in reference to plants; animals are no less sensitive. On the contrary, they respond more quickly given their mobility. Enough movements have been documented for animal species in relation to climate. Over the last century, movements towards the pole of 35 to 240 km have been described for 34 species of European butterflies, including "Catalan" species (12).

When there is an even greater deficit of water in semi-arid areas of certain places in the country and especially in the southeastern areas of the peninsula, vegetation is even slower to recover following multiple and prolonged droughts and/or fires. This means that it takes a long time to build new biomass and that there is often a degradation of the soil, especially if there has been overexploitation during dry spells or if there were recurring fires. This facilitates erosion and, in extreme cases, can lead to desertification. This problem is present in areas where the soil of degraded ecosystems are incapable of retaining the water provided by the occasional heavy autumn storms, which cause floods and further erosion.

In any case, predictions for the condition of Mediterranean ecosystems in the coming decades requires greater knowledge of their responses to climate changes, and of regionalized predictions of climate and land use. So it is still far from being available, due to the inherent variability and unpredictability of the climate system on a regional level. It should also be remembered that it is highly likely that changes and responses are not simply linear. Nor must it be forgotten that, more than from changes in climate and the atmosphere as we mentioned earlier, the Mediterranean region suffers from the abandonment of farmland and the fragmentation of ecosystems -two enormous changes in land use. All this should lead us to predict that, should things continue as they have up to now, it is likely that the coming decades will have more ecosystems in successive early stages with a lower ecological complexity.

And, of course, warming also affects humans who, although special, are just another species.

We could ask ourselves, finally, if we humans also notice climate change. Climate change affects us to the degree that it affects ecosystems and the environment in which we live, as just another, albeit special, species. We are affected in several ways, as we have seen also happens with different plant and animal species, depending on our exposure, sensitivity and ability to adapt. Therefore, the effect varies according to our geographic location and social, economic and environmental conditions. As always, the worst affected are the poorest countries. On the one hand, this is because their economies depend mainly upon activities such as agriculture, which are especially sensitive to climate change. On the other, it is because they have scant ability to adapt to changes such as the increase in sea level or drought, and the fact that they lack the proper health resources to reduce the growing risk of diseases related to climate change, such as malaria.

Within wealthy Europe, the Mediterranean areas or Arctic regions seem to be the most vulnerable. The people most affected are those whose activities are most sensitive to climate (farms, forestry services, hotels or fishermen, for example), and those living in deltas, coastal areas or small islands having a greater risk of flooding or displacement due to the rising sea level or flooding. Here in Catalonia, the moisture in the soil and water supply are decreasing, with the subsequent problems in agriculture, fire risk and tourism. High temperatures and heat waves can affect traditional summer tourist destinations, and the more unsafe conditions of snow at ski resorts could be costly to our winter tourism. Just as an example, farmers are seeing and will see how warming affects the suitability of the crops they farm on their land, harvesting potential, length of the growing season and the risk of frosts, pest epidemiology, the distribution and quantity of treatments with pesticides, the quality of their products, and so on.

Health aspects are not extraneous to climate change. For example, because pollen appears earlier and is produced in larger amounts, allergies are accentuated. There also seems to be an increase in the number of people exposed to the transmission of diseases the vectors of which are sensitive to warming. Noteworthy among these are malaria and dengue fever, without forgetting mosquito-transmitted encephalitis, leishmaniasis or cholera. It must also be kept in mind that the heat waves we will most likely suffer will have the greatest impact on the urban population, especially the elderly or infirm. Contrarily, shorter, milder winters should tend to reduce winter mortality.

All these examples remind us that climate change is very likely to affect people's wellbeing, distribution of wealth and opportunities for development. Since this is, or should be, of concern to society, civic policies and practices must be started in order to help diminish this progressive warming and the consequences it entails. Certainly these initiatives will be taken up in other articles in this issue.

Studies in time and space

In order to discover the extent to which the functioning and structure of Mediterranean ecosystems have been altered, new studies need to be carried out under experimental conditions that come as close as possible to natural ones, while taking advantage of technological advances in order to apply them to different scales of time and space, to give us an idea of the extent to which these processes are being altered.

Paleo-ecological studies of sedimentary evidence show us the changes in ecosystems associated with climate changes in past eras such as the recent Holocene Epoch. Of note are the transitions from wet periods to dry periods, with drastic changes in vegetation and erosion processes such as those that took place following the climatic optimum of five to six thousand years ago, which is particularly evident in arid, warm areas like the south of the Iberian Peninsula or, closer to home, in Menorca or Majorca13.

Studies of closer eras -the last few centuries- carried out using herbarium materials gathered in Catalan-speaking regions have shown changes in the physiology of vegetation produced over the last three centuries, along with atmospheric and climate changes. It has been proven, for example, that over this period, stomatic density has diminished by 21% and C (13) discrimination by 5.2% in all fourteen species studied, indicating a possible adaptation to today's warmer, dryer conditions by means of greater efficiency in the use of water.
Apart from experimenting under the most natural conditions possible and employing paleo-ecological and historic tools, studies on global change and its effects require successive ascension on the spatial scale from leaves to ecosystems, regions and the entire globe. Remote sensing techniques are used to study what happens on a regional and planetary scale. These techniques are based on the fact that reflected light, after falling on a material, shows different features, depending on the type of material as well as its condition14. Radio spectrometers installed on airplanes or satellites can measure green biomass through the proportion of radiation reflected in infrared or red. This enables the evolution of plant masses to be studied year after year. However, strict estimates of biomass, despite being of great interest, do not fully satisfy ecologists' needs. Measurements are needed, not just for the biomass, but also for the operation of vegetation and, if possible, of ecosystems. We now have more sensitive radio spectrometers available that are capable of measuring nanometer by nanometer, and of contributing information on the water content and physiology of the vegetation (14). This is all of special interest, for example, in the study of Mediterranean ecosystems, with foliar biomass that stays green all year. These new tools let us appreciate the almost nil activity of holm oak or pine groves in the summer, or their maximum activity in the spring, when water is available. Therefore, the new technological possibilities opening in the field of remote sensing should be taken advantage of in order to study the structure and operation of Mediterranean ecosystems and the changes being produced in response to climate change, as well as in response to other components of global change, such as changes in land use.

Settled in change

Our planet, like all the others, is settled in change, a change that on many occasions in the history of the Earth has been spectacular, more so than what we now know as the "Global Change". At any rate, many of these great changes have come about on a geological scale many times over a period of millions of years, while the current one is special because it is an accelerated change that is being produced over only a few decades (1). And it is important to remember that all the changes described in these past decades have taken place with a level of warming that is only a third or less that forecast for the coming century. Climate models are not perfect, but almost all of them, and the path temperatures have been taking to date, lead one to fear that they could be right. It is true that we will have to wait and see what the coming years bring, and the models may even fail in some way (the climate machine, and life, are immeasurably complex, not linear), but it would be unwise at the least to wait without acting to see if the heat, drought and torrential rains turn our land to desert, or if the sea swallows up the Delta.


References

1 - Peñuelas, J. 1993. El aire de la vida (una introducción a la ecología atmosférica). 260 pages. Ariel, Barcelona.
2 - PCC. 2001. The Scientific Basis. Third Assessment Report of Working Group I, A J. T. Houghton, D. Yihui, et al. editors, (Cambridge Univ. Press, Cambridge).
3 - Peñuelas, J., I. Filella, and P. Comas. 2002. Changed plant and animal life cycles from 1952-2000. Global Change Biology 8:531-544.
4 - Piñol, J., J. Terradas, and F. Lloret. 1998. Climate warming, wildfire hazard, and wildfire occurrence in coastal eastern Spain. Climatic Change 38:345-357.
5 - Peñuelas, J. and I. Filella. 2001. Phenology: Responses to a warming world. Science 294: 93-795.
6 - Peñuelas, J., I. Filella, F. Lloret, J. Piñol and D. Siscart. 2000. Effects of a severe drought on water and nitrogen use by Quercus ilex and Phillyrea latifolia. Biologia Plantarum 43:47-53.
7 - Terradas, J. 1996. Ecologia del foc. Proa, Barcelona.
8 - Peñuelas, J. and J. Llusià. 2001. The complexity of factors driving volatile organic compound emissions by plants. Biologia Plantarum, 44: 481-487.
9 - Peñuelas J, Filella I, Llusià J, Siscart D, Piñol J. 1998. Comparative field study of spring and summer leaf gas exchange and photobiology of the Mediterranean trees Quercus ilex and Phillyrea latifolia. Journal of Experimental Botany 49: 229-238.
10 - Peñuelas J, Lloret F, Montoya R. 2001. Drought effects on Mediterranean vegetation and taxa evolutionary history. Forest Science 47: 214-8.
11 - Peñuelas J., Boada M. 2002. Biome shift in the Montseny mountains in response to climate change. Global Change Biology, submitted.
12 - Parmesan, C., N. Ryrholm, C. Stefanescu, J.K. Hill, C.D. Thomas, H. Descimon, B. Huntley, L. Kaila, J. Kullberg, T. Tammaru, W.J. Tennent, J.A. Thomas and M. Warren. 1999. Poleward shifts in geographical ranges of butterfly species associated with regional warming. Nature 399:579-583.
13 - Peñuelas J. 2001. Cambios atmosféricos y climáticos y sus consecuencias sobre el funcionamiento y la estructura de los ecosistemas terrestres mediterráneos. AEET, CSIC Press. Ecosistemas mediterráneos. Análisis funcional. Granada. p. 423-455.
14 - Peñuelas J, Filella I. 1998. Visible and near-infrared reflectance techniques for diagnosing plant physiological status. Trends in Plant Science 3:151-156.


The Past is One of the Keys to the Future
Antoni Rosell i Melé
Institut de Ciències i Tecnologies Ambientals, Universitat Autònoma de Barcelona
Institució Catalana de Recerca i d'Estudis Avançats [Environmental Sciences and Technologies Institute. Autonomous University of Barcelona. Catalan Institution for Research and Advanced Studies]

From Palaeoclimatology -he study of the climate of geological and historical periods before the invention of meteorological equipment- the author describes the main aspects of the development of the climate over the last 500,000 years. He also shows how the climate changes without human intervention and also offers a historic perspective of more recent changes that are related to human activity.


Who has not asked, read or heard someone else ask questions like the following: "Are all these changes in the weather -the hailstorms, windstorms and droughts- normal? Is the climate really changing so much that we will never see the weather of our childhood again, the heavy snowstorms, the balmy summers? From now on, we'd best get ready. Who knows what could happen? And, if this is so, why is the climate changing and who is to blame? Is it the increase in greenhouse gases and, if so, the Americans, with their cheap petrol and their huge cars -such debauchery! Or is it the neighbor who goes to work by car every day and -what a cheek!- pollutes more than I do? And who will fix it all? Politicians never do anything, scientists only ask for money to understand nothing. And Kyoto, what a circus! The people who go to these things only travel around the world going to meetings and then never do anything! This business with the climate is very complicated." Everyone seems to agree with the last sentence.

All these questions are difficult to answer. The reason is that we really know very little about why the climate is changing. More to the point, we understand even less the reason why we have the climate we have anywhere in the world. I mean knowing precisely why, for example, the average temperatures in Barcelona, or on the planet, aren't 2, 5 or 10 degrees higher or lower, as they have been over several periods of the Earth's recent past. Or why are Greenland and Antarctica almost completely covered by ice in such a seemingly permanent way, when it hasn't always been like that? Or why is the Sahara now a desert, when it wasn't over 6,000 years ago? Or why is there a phenomenon like "El Niño" every few years, when the temperatures in the ocean around Peru increase with consequences that are felt around the world? Or why do we breathe air with a certain quantity of greenhouse gases, and not half or double the concentration, as it was thousands or millions of years ago? In other words, since the Earth was formed, what has led the planet to be the way it is now, especially to have the climate it has now? And if the climate has changed without the help of humans, why can't it continue to do so? In fact, the climate surely will change, but exactly why or when it will change is not fully understood.
There is a need to obtain answers to these and other similar questions, but not only to satisfy academic curiosity. They must be answered in order to address the questions asked at the beginning of the article, and in order to weigh the influence of our activities on the climate. If we don't know where we come from, can we know where we are and where we are headed? Many scientists think not, and that is why money and efforts are spent on studying the paleoclimate (defined in the Gran Diccionari de Llengua Catalana as the climate in geological and historic periods prior to the invention of devices used for meteorological measurements), and to inquire into how this has changed and why it has done so in a natural way. This article briefly sets forth some aspects of the evolution of the climate over the past 500,000 years or so, especially in regard to changes in temperature and to one of the main greenhouse gases: carbon dioxide. My aim is to show how the climate changes without human intervention, in order to offer an historic perspective on the changes that have taken place recently, which are therefore potentially related to human activity.

In the words of Winston Churchill:
"The further backward you can look, the further forward you are likely to see".

How the Paleoclimate is Studied

First of all, what is climate? Simply, the average weather in a certain spot on the planet. Or, put another way, the weather we should expect over a month, year, decade, century, etc. For example, variations in temperature, atmospheric pressure, humidity, wind, precipitation and other meteorological variables over the past 50 years in Catalonia would define the climate of the region. Changes in the values of these variables yesterday, or last week, do not represent changes in the climate; rather they are variability in the atmosphere or the weather. It is worth distinguishing between a variable that characterizes the climate, such as temperature, and a factor in climate change, or forcing, such as the composition of greenhouse gases in the atmosphere. Changes in temperature give us signs that the climate could be changing. Changes in atmospheric carbon dioxide do not necessarily indicate a change in the climate. The relationship between cause and effect must first be established. One way of doing so is to look at the relationship over time of variables that characterize climate directly (i.e. temperature), or indirectly (i.e. the presence of ice in the continent depends in part on the temperature, but also on variables such as precipitation), with factors of change such as the composition of the atmosphere. Due to the fact that these types of measurements have been taken for only a few years, the time series available are too short to show real variability in the climate, especially for the whole planet. By studying the climate of years past, thousands or many millions of years, we can extend these time and space series, and we can also try to search for eras analogous to the current one, and see how the variables of the climate system have been evolving while diverse factors of change have varied. For example, 400,000 years ago, during the so-called isotopic stage 11, conditions of the climate system are believed to have been very similar to those of the current period. Alternatively, an attempt can be made to identify a period of the past in which values for carbon dioxide were the same or higher than current levels, in order to see what the values of climatic variables were in greenhouse worlds. It is believed that these conditions have occurred several times during the Phanerozoic period (the past 550 million years), the last of which was probably during the transition between the geological periods of the Paleocene and Eocene Epochs, about 57 million years ago.

Now then, this is easier said than done, because it is very difficult to reconstruct past climates, especially in a quantitative way. It's fine to know that in the last glacial period it was colder than now (its maximum was 18,000 to 24,000 years ago), but it is more useful to inquire into how much colder it was in different areas of the planet, since not all of them respond in the same way to factors of change. For example, a volcanic eruption in the area of the Equator could contribute to cooling in both hemispheres of the Earth due to the effect of the aerosols that are formed, scattered about and reflected by sunlight. However, if there is an eruption in Iceland, to a great extent it only affects the Northern Hemisphere because, due to atmospheric circulation, volcanic aerosols do not reach the Southern Hemisphere. Quantitative paleoclimatic reconstruction is, in fact, a very new research field that has developed rapidly since the seventies. Because devices measuring temperature, humidity, etc. were invented a relatively short time ago, indirect methods had to be found (proxies) in order to estimate these variables in the past. What is first necessary is to find a temporal record from which some sort of climatic information could be extracted, such as marine or lake sediments, which have been constantly deposited over thousands or millions of years. But studies are also done on the growth rings of trees, coral, glacial ice and ice caps, among other more or less exotic materials or deposits. In my opinion, the prize for imagination is taken by a study for measuring chlorine isotopes in fossil urine remains from rat lairs in the Nevada desert in the United States, in order to reconstruct changes in cosmic rays, used to date sedimentary records (Plummer et al., 1997).

It must be said that the further back in time you go, the harder it is to study, because it gets more dificult to find continuous valid records from which to interpret properties in a precise way, for example, due to the dynamics of Earth, which eventually destroys paleoclimatic records while creating new ones. This means that, although the Antarctic has been covered in ice for many millions of years, the maximum age of this ice is no older than a half a million years, due to glacial dynamics, which makes the ice cap remain in constant movement until it ends up in the ocean. Marine sediments are also eventually "destroyed" or transformed in the subduction areas of continental margins. Many large lakes have also been formed "recently", such as the Baikal Lake in Siberia. Its sediments are probably no morer than 25,000,000 years old. Furthermore, the older the samples studied, the harder it is to date them precisely. The most widely used and most precise method, carbon-14 dating, is applicable for dating samples containing carbon, obviously, but for ages no older than 55,000-60,000 years. There are diverse techniques for dating older materials, but they either do not measure absolute dates, or their margin of error makes solving climate changes possible for less than a few thousand years. Comparatively, the margin of error of the carbon-14 method is around a few dozen years.

Paleo-reconstruction methods also have intrinsic limitations. For example, one way of reconstructing air temperatures is to associate annual plant distribution and their pollen with climatic regimes and the Earth's dominating temperature margins. If an old pollen sample is analyzed, then an attempt is made to relate its composition to a similar current distribution in some area of the planet, and deduce from there the most likely temperature values where the plants producing this fossilized pollen lived. Nevertheless, when you go far enough back in time, there comes a point where no plant found on the planet today existed. Climatic proxies often respond to more than one environmental variable. One of those most used is the measurement of the relationship between the amount of oxygen isotopes (expressed as d18O) in carbonate skeletons of marine organisms. This measurement fundamentally represents two combined climatic signs. One is a local sign, which is the temperature of the ocean in which the analyzed organisms lived. The other is a global sign, which is the volume of continental ice and, therefore, the level of the ocean. So in interpreting data, both effects must somehow be resolved. This also means that another key point is that reconstructions are approximate, with margins of error that are sometimes unknown. For example, it is difficult to understand how ecological relationships can affect the distribution of pollen in a certain place, or how this pollen moved from the plant that produced it to the place where it was deposited, such as the bottom of the sea. Therefore, it is very important in paleoclimatic studies to use more than one paleoreconstruction method in order to confirm the results from one technique or another. Lastly, it must be kept in mind that the climatic variables reconstructed are mostly of a local scope. Changes in temperature in Harare, Tarragona or New York will usually be quite different, due to the location of these cities on the planet. This means that many records from around the world must be studied in order to get a precise idea of global climate changes. On the other hand, changes in carbon dioxide or in sea level do take place simultaneously, to practical effects, in a global way, since gases in the atmosphere mix relatively quickly, and of course seas and oceans are for the most part interconnected.

Stability over the last 1,000 years and warming in the 20th century

The past few years have provided great advancement in our understanding of the "global" evolution of changes in air temperature over the past 10 centuries. A study of reference is that done by Mann and colleagues (1999) shown in Graph 1, obtained thanks to the combination of temperature data derived from the study of tree rings, ice cores, coral and historic documents, as well as thermometers for the past 140 years (see others at http://www.ngdc.noaa.gov/paleo/recons.html). It seems quite clear that temperatures in the 20th century, in the northern hemisphere, were the highest in the past 1000 years, with the decade of the nineties being the warmest of all, and 1998 the warmest year of the millennium. Furthermore, the magnitude of warming in the 20th century is unique during this period (0.6 ± _0.2°C), especially during the periods from 1919 to 1945, and from 1976 to 2000, when temperatures increased at a rate never before experienced, at least from the 11th to the 19th centuries. Data for the southern hemisphere before 1861 (from which time there were instrument measurements) are very scarce and, therefore, it is not quite known how temperatures evolved from the year 1000 in the southern half of the world. The record from Graph 1 has become emblematic, and the Intergovernmental Panel on Climate Change (IPCC) mentioned it in their last report in 2001 (IPCC, 2001).

Why is this warming happening? It is not entirely clear, but it is likely that it is not caused by one single natural or man-made factor. Changes in the climate can happen due to internal variability of the climate system and to external factors. The influence of external factors can be compared by using the concept of radiative forcing (energy radiating from a factor of change). This would be positive if it makes the Earth's surface warm up, or negative if it makes it cool down. Changes in the increase in the concentration of greenhouse gases, solar energy, vulcanism and the concentration of atmospheric aerosols affect radiative forcing in a positive or negative way. For example, the concentration of greenhouse gases (see carbon dioxide in Graph 2) in the atmosphere during the past 1,000 years has increased in the past 200 years in a way similar to that of the temperature in the northern hemisphere (Graph 1). This increase reflects the progressive use of fossil fuel in our society. Greenhouse gases have a positive effect on the increase of radiative forcing. Therefore, in the past 200 years, there could have been a progressive increase in the capacity of the atmosphere to absorb energy from the sun, which could have led to the gradual warming of the planet's surface. But it must be said that there are many other factors of change that have also varied over this same period. For example, the concentration of aerosols in the atmosphere has increased in an analogous way to temperature, caused by the progressive use of fossil fuel and biomass combustion (i.e. woods, rubbish) (IPCC, 2001). Its effect on the climate, however, is to cool the surface, although this is less well understood than greenhouse gases, making it difficult to judge its relative weight in climate change. Since we are just beginning to understand the relative influence on radiant energy of diverse factors, it is difficult to demonstrate in a conclusive way that the warming of the 20th century is due only to the increase in carbon dioxide and similar gases. For example, with mathematical models simulating variations in the Earth's temperature, and comparing the results with changes that have been measured, the causes of the main changes can begin to be glimpsed. The IPCC's 2001 report makes special mention of a study that mathematically simulated the variability of temperatures over the past 140 years, taking into account only factors of natural change (solar variability and vulcanism), or only man-made factors (greenhouse gases and aerosol estimates), or both (Crowley, 2000). In some ways their conclusion is not very surprising: by including man-made factors in the model, a large part of temperature changes in the past 140 years can be explained, but the correlation between the results of the model and real temperatures is even better if natural as well as man-made factors are taken into account. Furthermore, they conclude that although the factors of change considered can explain most of the changes, the possibility is not excluded of their being others that also contribute to warming in the 20th century. And so the debate continues, especially in order to clear up the relative weight of different factors of change and the mechanisms by which they act on the system. For example, by how much exactly does the temperature increase when the carbon dioxide content in the atmosphere is doubled? Or how do ecosystems respond to changes in the climate and the composition of the atmosphere?

Instability over the past 400,000 years

Regardless of natural change, the IPCC predicts that average global temperatures will increase between 1.4 and 5.8°C from 1990 to 2100. If this is the case, the rate at which temperatures are foreseen to rise will be unparalleled in the last 10,000 years. This is a geological epoch called the Holocene Epoch, in which humans are having our golden age. Climatically speaking, however, this period of time is quite unusual since it has been and continues to be very stable and long. Some have noted that this climatic stability is relative, and that there have been significant changes, so that human civilizations have been able to flourish or have failed depending on whether environmental conditions have been favorable or not (deMenocal, 2001). The norm in the climate system is change and instability. Changes in local or global temperatures of 2 or more degrees, on slow time scales (over thousands of years) or very rapid ones (within which is the average life span of a person or a couple of generations), have been very frequent until now, and nothing leads one to believe that in the future things will be any different. By studying fossil records, on any time scale, it becomes quite clear that the Earth's climate is anything but stable. This statement would have been heatedly debated a few decades ago.
Up until the decade of the nineties, it could be said that the general consensus among scientists was that the Earth swings between relatively cold (glacial) and warmer (interglacial) epochs in a progressive, constant way and at a rate between tens and hundreds of thousands of years without any noticeable short-term disturbance. These changes happen at the same rate at which sunshine varies (variations in the radiation of the sun's heat) which is a function of astronomic parameters stated in the theory of Milankovitch. This Serbian mathematician proved convincingly that the appearance of ice ages depends on the eccentricity of the Earth's orbit, and on the inclination and precession of its axis of rotation. These astronomical changes are very constant and have been repeated for many millions of years in cycles of fundamentally 23,000, 41,000 and 100,000 years. Using this theory as a basis, predictions can theoretically be made that the current interglacial period will end within 50,000 years, and that the next glacial maximum will be within 100,000 years without taking into account man-made effects (Loutre and Berger, 2000). Until recently, it all seemed quite well controlled, almost like clockwork. In the decades of the 60s and 70s, the concern was to find out when the next ice age would be, and few thought about global warming (Kukla et al., 1972). In fact, the temperatures of the ocean and the land have been dropping for about 6,000 years, and that can already be seen in the record of Graph 1. The tendency has been momentarily interrupted by the 20th century's warming. One could generalize and say that up to the decade of the 90s, most work centered on studying climate records that could not decipher short-term climate changes of a few hundred or dozen years. If any variability was seen on these scales, it was attributed to analytical error, or some kind of noise, or the scientific community in general did not give it much importance.

The study of ice cores in the Antarctic and Greenland, together with the detailed analysis of marine and lake sediment with high levels of sediment accumulation, revolutionized our way of understanding climate evolution. First, to prove the close relationship between an abundance of greenhouse gases and the climate on scales of thousands of years, and second, to reveal the frequency with which episodes of abrupt climate change occur, on scales of less than a century, which is a subject discussed in the next section. The ice in ice caps is, in fact, frozen atmosphere. In Antarctica, there are traces of the atmosphere from almost that last half a million years (Graph 3; Petit et al., 1999). In Greenland, recovered ice cores "only" go back 110,000 years. In part, this is due to the fact that it snows there more, which gives the ice records in Greenland higher resolution, making it possible to measure annual variability in the composition of the atmosphere. In records of the atmosphere of Vostok (in reference to the Russian station where samples were taken) in Antarctica, the highest values for greenhouse gases (carbon dioxide and methane) are found during the interglacial periods, and the lowest during the glacial periods (Graph 3). The correlation between values of methane and carbon dioxide with temperatures in Antarctica (estimated by measuring the hydrogen isotope ratio of the ice) suggests there is a close link between these gases and the climate, and it demonstrates the dynamics of oceanic and continental carbon sinks in response to climate changes. However, it is still not well understood how greenhouse gases interact with the climate system. The concentrations of gases increase for thousands of years before the great ice caps totally or partially melt. So it is not entirely clear whether it is the change in the greenhouse gases or sunshine, or both, which instigates passage from a glacial to an interglacial epoch and vice versa. Whatever the initiating mechanism, it is not clear either what makes methane and carbon dioxide fluctuate naturally over thousand-year scales. In any case, in the current context of the increase of greenhouse gases, Graph 3 clearly shows that current concentrations of carbon dioxide are the highest of the past 420,000 years and, therefore, without precedent in nature in all this time. The concentration of carbon dioxide is currently 365 ppm, while maximums over the last three interglacials did not exceed 300 ppm, even though values reached in epochs analogous to the current one are around 280 ppm, the same as pre-industrial concentrations of this gas. At the current rate of growth of the carbon dioxide content in the atmosphere, within a few years, the increase in this gas since the 19th century will have exceeded the increase observed between glacial epochs (200 ppm) and interglacials (280 ppm) by far. In reference to methane, its current values (1600 ppb) are already double the normal interglacial values (700 ppb), and its growth since the pre-industrial era has more than doubled (900 ppb) the normal growth from glacial maximum to interglacial (350ppb). Therefore, even though the consequences that may arise from this are not exactly understood, or they cannot be proven, it is not unusual that so many people around the world are worried about the growing level of greenhouse gases.

Surprising changes: for the climate, 2 plus 2 don't always make 4

One of the most widely known paleoclimatologists at an international level (Wallace Broecker, from Columbia University in the United States) has said that the mainly inoperative behavior of our society towards the increase in greenhouse gases is like "poking the angry beast with a stick" (http://www.earthinstitute.columbia.edu/library/earthmatters/spring2000/pages/page7.html). The stick would be the emission of greenhouse gases, and the beast would be the climate system: no one knows when or how it will react, but sooner or later it will. So, while scientists like Richard Lindzen of the Massachusetts Institute of Technology believe that concerns of global warming are a passing phase, according to some climate models (see his testimony before the U. S. Senate in May 2001, http://www.senate.gov/~epw/lin_0502.htm), scientists such as Broecker are part of a group of scientists, which I consider to be quite considerable, who are convinced that the behavior of the climate system during the last glacial teaches us that the increase in carbon dioxide may cause not just a gradual change in climate, but a complete reorganization of the climate system (Broecker, 1997). One of the things learned in the last few years is that a relationship between cause and effect does not have to be linked by a linear relationship. The climate system does not necessarily respond immediately to a disturbance. So a factor of change could begin to vary while climatic variables remain unaltered, or show little variation. This goes on until a line is crossed, from which the entire system quickly reorganizes to the point of reaching another situation of relative balance, or the change suddenly accelerates for no apparent reason, until it reaches a new situation. Climate models have demonstrated that the climate system can behave in non-linear ways (Stocker, 2000). Climate systems can even have various stable models of operation, even though the factors of change do not vary much. For years we have known that the oceanic circulation can vary among different stable models very quickly if, for example, the surface salinity of the North Atlantic drops below certain values (Stommel, 1961). For example, there are scientists who have demonstrated with models that the Sahara is climatically stable as desert or as green, and this situation has been true for the past 10,000 years (Claussen, 1998). This is also relevant in explaining why one can so often observe in paleoclimatic records, if one studies the right samples and pays attention, situations of extremely rapid climate change, in a matter of a few dozen or hundreds of years. Emblematic findings in this regard belong to the North Atlantic area.

In 1988, a German oceanographer, Hartmut Heinrich, published a study showing how 6 times during the last glacial, enormous fleets of icebergs invaded the North Atlantic, especially from Canada (Heinrich, 1988). When icebergs melt, the rocky material they carry is deposited on the bottom of the ocean in a 3,000-km area from one side of the Atlantic to the other. The reason for these "invasions" is the periodic collapse of the ice caps in the northern hemisphere, especially in North America, for reasons that are still argued over. One of the many interesting elements of these Heinrich episodes, as they are called, is that they let us see how the climate system responds to a localized disturbance of very short duration and how climate changes happen around the world. So, the large amount of fresh water that is dispersed into the ocean when icebergs melt makes the surface salinity of the North Atlantic diminish, altering the circulation on the surface and in the depths of all the world's oceans. One of the consequences was that the transportation of heat from low latitudes polewards, represented by the Gulf Stream, was halted, with the subsequent drop in temperatures in the North Atlantic region, for example, in Europe. Once the oceanic salinity rose to normal values, there was a point at which the circulation as it was before each Heinrich episode suddenly reestablished itself. At the same time, glaciers in the Andes and New Zealand grew and shrank, which gives an idea of the magnitude of the scope of these episodes. These changes took place in a matter of decades, and that is indicated by the swings in air temperature of ice cores in Greenland, changes in pollen in Italy or the wind speed in China, to mention a few examples (Dansgaard et al., 1993; Allen et al., 1999). The fact is that climate models as well as paleoclimatic reconstructions indicate that this disturbance made the climate system oscillate, in this case as represented by the ocean-atmosphere system between various stable models of operation in a matter of two to four decades. Furthermore, in particular, the studies on ice cores in Greenland show that these oscillations are very frequent (Dansgaard et al., 1993). They are called Dansgaard-Oeschger cycles, of which the Heinrich episodes would be a component (Bond and Lotti, 1995). This has broadly demonstrated how the variability of temperatures during the glacial epoch was very high, following cycles of around 11,000, 6,000 and 1,500 years. Still to be cleared up is the precise nature of these cycles, which could be semitones of the astronomic cycles of the Earth's orbit, or related to the internal dynamics of ice caps, solar variability or atmospheric and oceanic circulation.
Of particular importance is the fact that it has been proven that in the Holocene Epoch and during other earlier glacial/interglacial cycles, temperatures and the production of icebergs has also been found to vary in cycles of 1,500 years (Bond et al., 1997). Wallace Broecker and others believe that all these cycles are due to the variability of so-called oceanic thermohaline circulation (Ganapolski and Rahmstorf, 2001). Very simply, it can be described as if the ocean currents were a "belt" moving from south to north of the Atlantic over the surface, and the reverse at the bottom of this ocean. The end of the "belt" would be found to the north of the sea of Iceland, and the other end around Antarctica. The speed of the belt is given by the salinity gradient of the North Atlantic, from the surface bottomward, which makes the surface water denser than deeper water and, following with a simple simile, it sinks. The "belt" carries warmth from the south to the north of the planet. Currently, the belt is working, making northern Europe have much more benign conditions for living there than Canada (i.e. due to the Gulf Stream). If the "belt" stops, the North Atlantic and Europe would cool down. Many paleoceanographers believe that periodic changes in surface salinity, caused by icebergs or increases in precipitation, in the Atlantic Ocean are normal. If they take place during interglacial periods, the magnitude of the climate change deriving from it is less when compared to what would occur in glacial periods.

What does all this mean now? It has been proposed that, as a result of global warming, surface polar waters would become warmer, which could slow down thermohaline circulation by making the density of surface water decrease. There would also be an increase in atmospheric transportation of water vapor due to increased evaporation, which, in turn when it rained, would make salinity of polar water drop. All this could halt thermohaline circulation and cause reorganization in ocean circulation, with consequences that would be hard to predict. In countries such as the United Kingdom, Norway, the United States and Canada, among others, enough people are concerned about this scenario, and consider it to be plausible enough to have recently been financing research programmes for tens of millions of euros for specific research into this subject (e.g. http://www.nerc.ac.uk/funding/thematics/rcc/).

Conclusions: Why is the climate and its study so complicated?

Climate changes do not depend only on an increase or drop in greenhouse gases, but also on the interaction of the planet's internal elements (i.e. atmosphere, hydrosphere, biosphere and cryosphere) and external elements (e.g. variability of the sun's irradiation, sunlight, vulcanism) in a way that we are just now beginning to understand. Of course, one must also keep in mind the impact of humans on the environment. Apart from the large number of elements of which the system is composed, many of them interact by means of positive or negative feedback, which is often related in a non-linear way. Therefore, under certain conditions, there could be more than one state of balance, and transition among them could be reversible or irreversible, and often quick. The system's sensitivity to variations of any factor of change cannot be well established either, and it is not the same for all of them. Frankly, we still lack a great deal of information in order to understand the mechanics of the system. Given this complexity, the use of mathematical models is truly essential to weighing the relative importance of the diverse components of the system, and to be able to predict their likely evolution. The veracity of these models depends on the contrasting of their results with real data.

One of the goals of this article was to show how paleoclimatic reconstruction studies contribute in an important way to understanding the climate system by contributing information that is lacking in order to build a representation of its structure and behavior. Seeing how the climate has evolved through time, we are learning what the true nature of its dynamics is, in order to begin to understand which factors are making the system change on different levels of time and space. Therefore, we can gain a certain perspective on the changes that are taking place today. One more example would be the following. Recent studies have shown that variations in carbon dioxide from the Miocene Epoch until now (the last 24 million years) have stayed relatively constant (Graph 4), despite the clear cooling the Earth has undergone over this period of time, as demonstrated by the growth of ice caps, ecological changes and drops in ocean temperature (Pagani et al., 1999; Pearson and Palmer, 2000). This could prove that carbon dioxide, by itself, is not a key factor controlling global climate change on a long-term scale. These results have already been used by some to defend inaction against the current increase in greenhouse gases (for example, see the comment on the article by Pearson and Palmer, in charge of the Center for the Study of Global Change and Carbon Dioxide at http://www.co2science.org/journal/2000/v3n23c1.htm), obviating in part the fact that the study discusses long-term changes. Nevertheless, it could be that at relatively low concentrations of carbon dioxide, the climate system may become more sensitive to other factors of change, such as ocean circulation (Pagani, 2002). Contrarily, when the Earth has had carbon dioxide contents in the atmosphere over 6 times greater than current levels ("super-greenhouse world" during the Paleocene/Eocene), the global climate was extremely warm, and the effect of other factors of change could have been extinguished.

In fact, we still have a long way to go before understanding current and past changes in our environment well enough. It seems clear to me, even so, that paleoclimatic records prove that the current climate is changing, and that with the modification of our environment an experiment of uncertain results is being carried out, because the current conditions have not been seen on the planet for at least the last 420,000 years, and possibly the last 25 million years. It could be argued whether or not this experiment has been approved by people, since most continue their daily activities with little difference from when not much was known about these subjects, regardless of the public position of government. Possible consequences and risks may not be very well understood by everyone, but at any rate, right now, they cannot be proven conclusively. In order to do so, research must continue in a strategic way, and there are international initiatives to convince scientists, scientific managers, politicians and society in general that priorities in research need to be modified (see, for example, documents from the International Geosphere-Biosphere Programme, such as the Amsterdam declaration at http://www.sciconf.igbp.kva.se/fr.html). It seems paradoxical that so little importance is given to researching the planet's "health", in relation to other subjects, when our wellbeing depends on it fully. Furthermore, a challenge that is worth taking on in order to understand the climate system is that traditional research approaches are incapable of grasping its true complexity, since the climate system transcends the limits into which natural sciences are still divided, following traditional patterns. Therefore, new approaches are needed to promote multiple disciplines in the sciences and in forming research teams. Here at home, it is still difficult to find enough institutions that are prepared to take on these challenges and develop research space that could eventually mirror such centers of reference as the Tyndall Centre for Climate Change Research in the United Kingdom, or the Potsdam Institute for Climate Impact Research in Germany. In any case, one needs to be optimistic, and the current promotion of networks of excellence in research within Catalonia and Europe allows work teams to be formed that have enough diversity of knowledge to begin making advances in this field.

Bibliography

  • Allen J. R. M., Brandt U., Brauer A., Hubberten H.-W., Huntley B., Keller J., Kraml M., Mackensen A., Mingram J., Negendank J. F. W., Nowaczyk N. R., Oberh„nsli H., Watts W. A., Wulf S., and Zolitchka B., 1999: Rapid environmental changes in southern Europe during the last glacial period. Nature 400, 740-743.
  • Bond, G., Showers, W., Cheseby, M., Lotti, R., Almasi, P., deMenocal, P., Priore, P., Cullen, H., Hajdas, I. and Bonani, G., 1997: A pervasi millenial-scale cycle in North Atlantic Holocene and Glacial climates. Science 278, 1257-1266.
  • Bond, G.C. and Lotti, R., 1995: Iceberg discharges into the North Atlantic on millennial time scales during the last glaciation. Science 267, 1005-1010.
  • Broecker, W.S., 1997: Thermohaline circulation, the Achilles heel of our climate system: will man-made CO2 upset the current balance? Science 278, 1582-1589.
  • Claussen, M., 1998: On multiple solutions of the atmosphere-vegetation system in present-day climate. Global Change Biology 4, 549-559.
  • Crowley, T.J., 2000: Causes of climate change over the past 1000 years. Science 289, 270-277.
  • Dansgaard, W., Johnsen, S.J., Clausen, H.B., Dahl-Jensen, D., Gundestrup, N.S., Hammer, C.U., Hvidberg, C.S., Steffensen, J.P., Sveinbj"rnsdottir, A.E., Jouzel, J. and Bond, G., 1993: Evidence for general instability of past climate from a 250-kyr ice-core record. Nature 364, 218-220.
  • deMenocal, P.B., 2001: Cultural responses to climate change during the Late Holocene. Science 292, 667-673.
  • Ganapolski, A. and Rahmstorf, S., 2001: Rapid changes of glacial climate simulated in a coupled climate model. Nature 409, 153-158.
  • Heinrich, H., 1988: Origin and consequences of cyclic ice rafting in the Northeast Atlantic Ocean during the past 130,000 years. Quaternary Research 29, 143-152.
  • IPCC, 2001: Climate Change 2001: the scientific basis: Contribution of Working Group I to the Third Assessment Report of the Intergovernmental Panel on Climate. Cambridge: Cambridge University Press.
  • Kukla, G.J., Matthews, R. and Mitchell, M., 1972: Present Interglacial: How and When Will it End? Quaternary Research, 261-269.
  • Loutre, M.F. and Berger, A., 2000: Future climatic changes: Are we entering an exceptionally long interglacial? Climatic Change 46, 61-90.
  • Mann, M., Bradley, R. and Hughes, M., 1999: Northern Hemisphere Temperatures During the Past Millennium: Inferences, Uncertainties, and Limitations. Geophysical Research Letters 26, 759.
  • Pagani, M., 2002: The alkenone-CO2 proxy and ancient atmospheric carbon dioxide. Phil. Trans. R. Soc. Lond. A 360, 609-632.
  • Pagani, M., Freeman, K.H. and Arthur, M.A., 1999: Late Miocene atmospheric CO2 concentrations and the expansion of C4 grasses. Science 285, 876-879.
  • Pearson, P. and Palmer, M., 2000: Atmospheric carbon dioxide concentrations over the past 60 million years. Nature 406, 695-699.
  • Petit, J.R., Jouzel, J., Raynaud, D., Barkov, N.I., Barnola, J.M., Basile, I., Bender, M., Chappellaz, J., Davis, M., Delaygue, G., Delmotte, M., Kotlyakov, V.M., Legrand, M., Lipenkov, V.Y., Lorius, C., P‚pin, L., Ritz, C., Saltzman, E. and Stievenard, M., 1999: Climate and atmospheric history of the past 420,00 years from the Vostok ice core, Antarctica. Nature 399, 429-436.
  • Plummer, M.A., Phillips, F.M., FabrykaMartin, J., Turin, H.J., Wigand, P.E. and Sharma, P., 1997: Chlorine-36 in fossil rat urine: An archive of cosmogenic nuclide deposition during the past 40,000 years. Science 277, 538-541.
  • Stocker T. F., 2000: Past and future reorganizations in the climate system. Quaternary Science Reviews 19, 301-319.
  • Stommel, H., 1961: Thermohaline convection with two stable regimes of flow. Tellus 13, 224-230.


Rersources for studying climate change in Catalonia:
An historic view

Javier Martín Vide
Chair of Physical Geography, Universidad de Barcelona

The author looks at the tradition of studies of the climate change in Catalonia. He describes the development of measuring instruments and also the cultural traditions of a religious and civil nature related to the climate. He also reminds us of two historic examples: the great drought of 1566-1567 and lo any del diluvi ["The Year of the Deluge"].


1. Introduction

It is well known that any analysis of climate evolution, including its tendencies, requires long periods of meteorological recording in order to build climatic series. No conclusions whatsoever may be drawn on the evolution of climate over three, five or ten years, because the inherent variability of the climate system produces multiple irregularities and saw tooth curves around average values. Several particularly dry or rainy, warm or cold years could be linked together without there being a tendency towards climate conditions that are different from pre-existing ones. Moreover, perception, which is always subjective and selective, highlights certain recent episodes as exceptional or record-breaking, when a review of a correspondingly long climatic series retrieves from forgotten memory the existence of other similar, or even more extreme, events, or attributes a certain normality to the former.

Climatic series -which in addition to being lengthy, must fulfil several requirements, the main one being homogeneity- serve to establish the normal or characteristic values of the climate in a certain place or region. Only within the context of a long period of time, preferably over a few centuries, and using data obtained with the same criteria and under the same circumstances, can any presumable irregularities, fluctuations and changes in climate be correctly evaluated, confirmed or rejected.

In a strictly climatic sense, instrumental climate series, or those constructed from meteorological records with devices, have the unavoidable limitation of the date the corresponding meteorological instruments were invented. Most of them were invented in the 17th century (the thermometer in 1600, the barometer in 1643, etc.). In the best of cases, some lucky place could have meteorological records dating from the 17th century, although this does not guarantee homogeneity or continuity. This is the case of Paris, for which we have certain disperse values for atmospheric pressure and temperature from the 17th century.

However, other non-instrumental records or notations of a meteorological or similar nature should also be considered for their potential value in reconstructing climate. This new information of a documentary nature, from which it is possible to construct series of indices or frequencies of certain phenomena, allows the time line of climatic series to be extended, in some cases going back several centuries prior to the use of conventional meteorological instruments.
Consequently, the past must be considered in order to precisely evaluate what happens today, and in order to predict present weather as well as future climatic forecasts. Reconstructing climates of the past contributes a great deal, oddly enough, to knowledge of the future climate. But this runs into the time limit of the instrumental meteorological records available, which in most cases is a few dozen years. Only in some exceptional cases are instrumental series of more than two centuries available.

2. The oldest instrumental records in Catalonia

The institutionalisation of meteorology in Spain, through the creation of an initial body to centralize observations made in the nation, did not happen until the second half of the 19th century, in 1860. This does not mean that no meteorological observations were made earlier in different places, especially in universities and institutes of higher education, as well as the Marina de San Fernando (Cadiz) observatory, in this case of an official nature, since 1805. Yet we can go back even further in time to the late 18th century when, in three Spanish cities -Cadiz, Madrid and Barcelona- some enlightened physicians and pharmacists took the initiative to systematically observe -from their own homes and several times a day (generally 3)- atmospheric pressure, temperature, the state of the sky and other phenomena.

In fact, in Barcelona on January 1, 1780, a doctor, Francisco Salvá Campillo, began to record, from his home on Petritxol street in the Gothic quarter, atmospheric pressure and temperature, as well as other elements, three times a day. As happens, he as well as other physicians and some pharmacists, who within the context of enlightenment in that era were aware that certain weather conditions favoured a spreading of the vectors causing illnesses or their worsening, decided to take the philanthropic initiative of systematically observing certain meteorological variables using precise instruments (in the second half of the 18th century, there were excellent barometers and thermometers).

In the case of Barcelona, the initiative begun by Francisco Salvà was, following his death, continued with other colleagues whose records linked, without continuity, to official ones recorded in the university of Barcelona from the second half of the 19th century until today (Table 1). Barcelona is, therefore, the city with the longest series of atmospheric pressure and temperature in Spain. In the European context it is situated, by age, in ninth place in the ranking of cities having continuous monthly series (fruit of the average of daily records) of atmospheric pressure (Graph 1). Those begun in the 18th century -which currently makes them over 2 centuries old- are: Basel (from 1755), Milan (1763), Paris (1764), Geneva (1768), Trondheim (1768), Edinburgh (1770), London (1774), Vienna (1775), Barcelona (1780), Lund (1780), Madrid (1786) and Prague (1789).

3. The oldest meteorological observers without instruments in Catalonia

The historical collections of some archives and universities offer pleasant surprises to climatologists interested in going as far back in the past as possible in the search for meteorological information. The University of Barcelona library stores two books of memoirs by Josep Montfar i Sorts, of noble family, who lived in Barcelona in the 17th century. Without explaining why, Josep Montfar observed and took down each day for the 5 years between 1683 and 1687 the amount of rain and its duration. This is non-instrumental information in regard to the intensity of precipitation and is limited in time. However, because it is derived from systematic observation, it is useful at least in generating a brief series of the occurrence of rain in the city of Barcelona at a climatically interesting point in time, within the so-called late Maunder minimum, and can be compared to current periods. Josep Montfar's work has few known precedents in Spain (only Diego de Palominos in Jodar (Jaen) was earlier than the Barcelona nobleman, with meteorological observations between 1556 and 1595).

Josep Montfar's notes offer evidence that the persistence of days with precipitation in the aforementioned five-year period of the 17th century was quite similar to today's. Furthermore, the distribution of rainy sequences according to length is adjustable by means of a first-class Markov chain, as currently happens.

Rafael de Amat y de Cortada (1746-1818), Baron of Maldá, is another of the figures whose personal legacy is of interest in studying the climate, due to his notations on certain conditions of the atmosphere with reference to Barcelona. The nobleman from Barcelona was apparently very sensitive to meteorological changes, aside from his scientific curiosity. In the more than 50 volumes of his Calaix de Sastre one can find notations that are curious and before his time, such as the following, in regard to a winter storm in the Catalan capital:

Lo dels trons ha vingut molt de nou per cosa extrahordinaria, pues que no acostuman a comensar les tronades que a mediats de Abril fins al Octubre. Es prova de haver fet mutació los Climas, y variat se lo temps per lo que mira a les estacions alguns anys ha. [The thunder has come as something new because of its extraordinariness, since thunder does not usually begin until mid-April up to October. It is proof that the Climates have mutated, and the weather has varied compared to seasons a few years ago.]

The Barcelona nobleman was detecting with extreme acuity a climatic irregularity that happened in Catalonia at the end of the 19th century, between 1760 and 1800, which was characterized by some highly irregular pluviometric patterns, with a simultaneous increase in droughts and floods. The irregularity was felt in the fields with low production, shortages and the corresponding social crises (Motín de Esquilache, 1766; Rebomboris del Pa, 1789). The reader must notice that popular expressions about the climate having changed -here we are not referring to the reality of today's climate change- or that the weather is crazy, are not new, but have precedents that are quite a bit older than one might think.

4. The potential of documentary proxy data

Prior to the existence of instrumental meteorological data and qualitative meteorological information, the only source for climatic reconstruction is the use of proxy data, or data and information that is similar or indicative and related to atmospheric conditions, of very diverse types and origins. Proxy data have in common the fact that from them one can derive meteorological or climatic information that, when it is suitably developed, can be expressed in indices and, through calibration, even as common climatic values. For example, dendroclimatology or dendrochronology, which is a branch of paleoclimatology, considers as proxy data the annual growth rings of trees, whose thickness and density depend on the temperature and precipitation in each season. Without leaving the historic archives of Catalonia, proxy data with great potential is the documentary information on damage caused by flooding and, in particular, news on pro pluviam rogations, or prayers for rain. Their collection, evaluation and exploitation is, among others, one of the objectives of so-called Historic Climatology, one of the branches of paleoclimatology that is furthest, at first glance, from the statistical methods characterizing conventional climatic analyses. Historic archives and legacies, whether they are civilian, ecclesiastical or private, constitute the primary source at which to begin searching for this type of information. The arduous task of consulting historic documents is sometimes made easier by the existence of certain books or collected memoirs that summarize the original documents. The collections made in the 20th century by José María Fontana Tarrats, unpublished, on different Spanish regions also constitute a wealth of information to be explored. The volume dedicated to Catalonia is entitled Historia del clima en Cataluña. Noticias antiguas, medievales y en especial de los siglos XV, XVI y XVII [History of Climate in Catalonia. News from Old and Medieval Times and especially from the 15th, 16th and 17th Centuries]

One of the most interesting and at the same time valuable documentary proxy data to be extracted from historic documents in Catalonia and the rest of Spain is that concerning the celebration of pro pluviam rogations, or prayers asking for rain in times of drought. Indeed, from at least the 16th until the 19th centuries, such news abounds in chapter records, of religious origin, as well as in municipal records. In fact, these religious ceremonies continue in our day, although current celebrations are not observed, nor are they as regular as they were in the centuries mentioned. Then, they responded to a perfectly regulated mechanism, in which different institutions intervened and, more importantly, they remained unchanged throughout time. In this way, to the series of plurisecular rogations one could also attribute homogeneity, a fundamental requirement for later chronological analysis.

The genesis of pro pluviam rogations began when the peasants detected a noticeable lack of rain that could compromise their harvests. In this case, they transmitted their concern -anxiety at the time, because with rudimentary commercial mechanisms, shortages in harvests turned into hunger and illness- to the corresponding guild institutions. The guilds, evaluating the gravity of the situation, sent their leaders to civic authorities, before whom they presented the problem. Usually, the civic or municipal authorities verified the magnitude of the problem of water shortage. In order to do so, they checked the water level in the wells, the volume of flow of the irrigation channels, etc. When the situation really did threaten primary production activities, the civic authorities gave the order to ecclesiastic authorities to convene a rogation ceremony. The latter made the final decision on the day on which, according to the liturgical calendar, they would begin. In conclusion, note that several institutions intervened, particularly the civic and ecclesiastical authorities, whose interests were opposed. The civic authorities were very cautious about convening a rogation session because they had to pay for it (decorating the streets, wax, paying musicians and professional pilgrims, etc.), while the religious authorities had an interest in holding them because of the service and the ascendancy over the people that this involved. In Spain, this guaranteed a regularity in the procedure which, in climatological terms, meant homogeneity of documentary records that derived from them. From the middle of the 19th century, within the liberal context of the era, the pro pluviam rogations lost credit, and their strict, descriptive rules were no longer followed. They then stopped serving as proxy data, but by that time there were meteorological observatories to supplement the information derived from the prayers. In any case, an advantage of the information on pro pluviam rogations was the duplication of their documentary record, which appears in municipal records, because their order to convene was recorded, and in the chapter or ecclesiastical records, which also recorded the dates on which they were carried out. Therefore, the historical climatologist has the security of dating, and a supplementary source in case any of the records is missing.

One of the most interesting facts of the pro pluviam rogations, and one of the most climatically valuable, is that the religious ceremony was of one type or another, depending on the gravity of the drought. In other words, different levels of drought intensity can be established according to the type of ceremony: the more solemn the ceremony, the greater the need for water. Therefore, in most of the cities studied, such as the Catalan Episcopal Sees, Toledo, Seville, Murcia and other cities, the rogation convened for a certain need for water as a result of a dry period was a simple prayer, usually within the mass, to an interceding saint. If the drought persisted, the solution was sought before a saint of greater "rank" by means of exhibiting his or her image or relics on the high altar of the cathedral or the parish church. When the problem became more acute, the ceremony consisted of a solemn procession through the main streets of the town with the image of the most venerated saint. In very serious cases, the relics or image of a dearly loved saint, virgin or cross were submerged in the waters of the harbour, town river or a spring. This ceremony was banned by the Vatican at one point due to the deterioration this caused to the images, although a simulation of this type of rogation was maintained. Finally, in extreme situations -there are scarcely two or three cases registered in Catalonia as well as western Andalusia between the end of the 16th century and the mid 19th century- there were mass pilgrimages to the chapel of a very important saint or virgin, such as Montserrat or El Rocio. The regularity of this procedure, with the same sequence and hierarchy of interceding saints in each city -although they differed one from another- provides historical climatologists with an index on the gravity of the drought. In this way, each phenomenon is dated, making it easy to establish their frequency and persistence over time, as well as to know the intensity of the droughts, by means of a 4- or 5-grade scale.
Other information of great climatic interest is that related to the damage done by river flooding, whether losses were human lives or heads of cattle, damage to infrastructures such as bridges, etc., which were regularly recorded by the city's notary public in municipal records. There is a great deal of this type of information from long ago, especially in principal cities having important rivers running through them or located on their banks. In combination with the pro pluviam rogations, news on flooding can help to reconstruct the extreme patterns of precipitation throughout several centuries. Graph 2 shows, by means of indices, the frequency of droughts and floods in Catalonia for the Little Ice Age, a period of relative cold in Europe running from the 14th-15th centuries to the mid 19th century.

5. Two Examples of Climatic Reconstruction in Catalonia: The Great Drought of 1566-1567 and lo any del diluvi ["The Year of the Deluge"]

Document records on pro pluviam rogations and other information in several Catalan cities has made it possible to reconstruct the episode of the great drought of the years 1566 and 1567. For the city of Barcelona, which suffered the full severity of the drought, Table 2 summarizes the information contained in this respect in the Manual de Novells Ardits, the city's official account book.

Although the above information does not allow for reconstruction with total precision of the length of the sequences of dry days during this episode, it seems that from February 22nd to May 6th, 1566, coinciding in large part with the spring, there were two dry sequences with a duration of a little more than a month. With recent data from the last thirty years internationally, indications can be made that dry spells of the indicated length are not unknown in springtime in Barcelona, although the appearance of two in this season in the same year is exceptional.

Throughout Catalonia, the main effects of the drought were the loss of harvests for the two years, with a general scarcity of food, especially in inland villages that had difficulty in receiving grocery supplies. Testimonies on the loss of harvests are abundant. In the Ceremonial antic of Lerida, it is said in regard to the years 1566 and 1567:

[…] de tot aquell any ni del altre apres fins en lo Agost no plogue aixi que nos culliren ninguns blats per los secans y per les hortes mol pochs de hont valent se lo blat al sementer a sis y a set sous faneca vingue a la era a valer a vint sous y a mes la faneca de hont la gent resta spantada. [(…) in all that year nor the other until August did it rain, so we harvested no wheat in the dry land and in the vegetable gardens very little, only making use of the wheat for seed at six and seven sous making the threshing worth twenty sous and apart from the work the people are scared].

In Flix, J. Vilanova, a member of the Cortes, wrote:
Not q en lo any 1566 feu gran seca q de un any no plogue fins a 7 de maig q plogue una bona pluja y no sembraren de ça Urgell y en Urgell encara q sembraren no si colli […] [ I note that in the year 1566 there was a great drought that in one year it did not rain until May 7th, when good rain fell, and no sowing was done from here to Urgell and in Urgell what was sown was not harvested].

In the same way, the flour millers in some cities, such as those in Tarragona and Tortosa, had great difficulty in their operation due to the low flow of their respective rivers. In the more important places such as Barcelona, Gerona, Lerida, Tortosa, Seu d'Urgell, Igualada and Cervera, the highest-level rogations were made.

The year 1617 has made history in the climate of Catalonia as lo any del diluvi ["the Year of the Deluge"], due to the episode of torrential rains that took place between the last days of October and the first twelve of November over a large part of the region, as well as in Valencia and other regions. The episode has generated abundant, detailed documentary information on the damage caused, especially to urban infrastructures. Without doubt, due to the destruction produced, the episode must be classified as catastrophic throughout Catalonia. However, from a climatic viewpoint, without pluviometric records, it may not have been exceptional in some of the cities affected. A reconstruction of its effects, done by M. Barriendos is shown in Graph 3.

Bibliography

  • Barriendos, M. (2000): "La climatología histórica en España. Primeros resultados y perspectivas de la investigación", in García Codrón (coord.), La reconstrucción del clima de época preinstrumental, 15-56, Santander, Universidad de Cantabria.
  • -Barriendos, M. and Martín Vide, J. (1996): "El tema recurrente de las sequías. La gran sequía de 1566-1567 en Catalunya", in Desertificación y degradación de suelos en España, 41-43, Barcelona, Department of the Environment.
  • Barriendos, M. and Martín Vide, J.(1996): "Aplicación metodológica de procesos markovianos a series documentales de ocurrencia diaria de la precipitación en Barcelona (siglos XVII-XVIII)", in Marzol, Dorta y Valladares (eds.), Clima y agua: la gestión de un recurso climático, 261-270, La Laguna.
  • Martín-Vide, J. and Barriendos, M.(1995): "The use of rogation ceremony records in climatic reconstruction: a case study from Catalonia (Spain)". Climatic Change, 30, 201-221.
  • Martín-Vide, J.(1997): Avances en Climatología histórica en España/Advances in historical Climatology in Spain, Barcelona, Oikos-tau

Interview with Richard Lindzen
Chair of Meteorology and Environmental Physics at the Massachusetts Institute of Technology (MIT), Boston

Man-made climate change is no great threat

Richard Lindzen is one of a subspecies of scientist, a minority but nonetheless real, with a penchant for going against dominant belief. Short and chubby, sporting a thick, coal-coloured beard and chain smoking -when in the United States smoking makes you almost a criminal- Doctor Lindzen is brilliant and ironic in defending his arguments. From the pulpit of true science, he declares that man-made climate change is no great threat to the future. All in all, it is an answer to the interests of a large number of scientists who travel around the world discussing climate change and backing arguments that have more to do with religion than with science. Even so, Professor Lindzen took part last spring in a seminar organized as part of the tenth-anniversary celebration of the School of Environmental Sciences at the Autonomous University of Barcelona.

You do not agree with those -and there are many- who assert that global warming is in large part caused by human activity. Why?

Simply because it isn't true. As far as the change in temperature on Planet Earth goes, we scientists agree on the fact that over the past century, the global temperature has risen by 0.5ºC. What else do we scientists know and what else do we agree on? The Earth's temperature is always changing. It is a dynamic process: warming was concentrated during the period between 1919 and 1940, as well as between 1976 and 1986. Contrarily, cooling took place between these two periods. We are currently in a stage of high temperatures, and fluctuations give us record-breaking years. But that is not an indicator of future trends.

If the increase in carbon dioxide in the environment is not due mainly to human activity, what would explain this phenomenon?

Man-made greenhouse gases are much less important in the process than natural substances such as water vapour and clouds. What is important is natural variability, a phenomenon with which science is still not very familiar. We really don't know what relationship there is between human activity and climate change. I can state, however, that halting emissions into the atmosphere would not immediately modify CO2 levels, and neither would a reduction of emissions halt the increase of gas into the atmosphere.

Therefore, you feel the Kyoto Protocol is nonsense...

Having all countries adhere to the Protocol and fulfil it would not and will not have any significant impact on the climate. If we are truly concerned about our grandchildren and great-grandchildren, it seems to me that they deserve a much better legacy than the Kyoto Protocol.

Heads of state and of government, many scientists and citizens see things very differently...

The perception of true scientists is very different from that of non-scientists. We are already used to this, and many scientists have reacted: in the United States, 90% of the scientific community has decided not to appear before the media.

It is possible that scientists who have made the decision to disappear from the public eye will have trouble finding funds and resources for research.

That is part of the problem. Today, being an alarmist has become a crucial factor in obtaining resources and scientific recognition. If, as a scientist, you are used to arguing that the future of the planet and of generations to come are in danger, you are much more likely to get money than if you stand by scientific reason.

Do you have trouble getting resources for research?

A very important part of my job is theory. I observe and analyse storms and clouds, and how these phenomena respond to climate change. Fortunately, it is not very expensive research, although I work with some colleagues from NASA and we use highly refined data that we get from satellites.

What does your research contribute to climate study?

I do not agree that we have to reduce theories to the development of large models. I think we should return to studying basic physics and processes, and use this work to determine more precisely space and time requirements for making observations. Current research methodologies are inadequate in this sense. For example, a researcher cannot decide to simply measure clouds. Clouds vary according to time scales, and their properties depend on the zenithal angle. All of this can tell us a great deal about climate.

What are the problems with the current research model?

There are several. In the first place, politicians and science managers must put aside their ingenuity: instead of promoting alarmism, they should design science support systems that encourage problem solving.

Should resources be distributed according to different criteria?

In any case, it shouldn't be done with current criteria. Today, if you look at the structure of resources in the field of science, surprising things happen. For example, if you argue apocalyptically that the world is progressing towards its end, or if you work for the group called the International Panel on Climate Change (IPCC), even if you have no reputation or credibility as a scientist, you have many possibilities of getting funds for research. You're playing on a team with researchers who want to save the world. It's clear that today ecological thought sells; it makes you a good person following the right path. Even many scientists support the ecological movement. Today it is fashionable to be against technology.

Why?

It's an historic dynamic. There are periods in history dominated by technological pessimism, and others in which optimism is greater in regard to technological development. Today we are clearly in a period of pessimism. There are periods in history that run parallel to the current situation. For example, the debate that took place in Great Britain when they wanted to introduce electricity in homes. The government demanded a report from the Royal Society. This scientific institution said that gas was enough for most people, and that there was no need to install electricity because no one would use it. Fortunately, the politicians that had to make the decision did not let themselves be swayed by technological pessimism and a lack of trust in progress.

Is this criticism of the system of distributing resources for science valid for Europe as well as the United States?

Despite the fact that my criticism is general, there are some differences between Europe and the United States. My country has a more decentralized structure in which private universities have more weight, as is the case of the Massachusetts Institute of Technology (MIT) in Boston. Yet in Europe, perhaps due to centralization, it is difficult to make a distinction between science and politics. There is a great deal of bureaucracy that contributes to building the system I described.

What role does industry have in all this debate on climate change?

Industry never wants to act in a politically incorrect way. Its objective is to do business, make money. Therefore, it avoids confrontation on matters that are not well known.

You argue that the contribution of man-made emissions to climate change is exaggerated; that we really do not know what relationship there may be between climate change and human activities. But what about the precautionary principle?

It seems to me that science will prove that man-made climate change is no great threat. Having said that, I have thought about the precautionary principle. However, I have come to the same conclusion as a few years ago regarding coffee. A study that did not have sufficient scientific basis said that this drink that I like so much produced cancer. I didn't stop drinking it; I didn't apply the precautionary principle. I wasn't convinced, and I liked coffee too much. I see no difference in the case of climate change.

Beyond scientific research, which at least raises serious questions, what would you support doing from an economic and social point of view?

I support adaptation processes, building more adaptable societies. What does this mean? When there is an earthquake in the area of California, in the United States, at the most four or five people die. It doesn't matter how strong the quake is, infrastructures and houses are ready for it. On the other hand, the same earthquake in another corner of the planet causes thousands of deaths. Building more adaptable societies means helping and investing in developing societies. As I see it, that is the real precautionary principle.


Environmental regulations

The Kyoto Protocol: an instrument of the future
Ignasi Doñate
Lawyer specialised in environmental issues

1. Introduction

1.1 The Challenge of Climate Change

Climate change was at the center of speeches on World Environment Day 2002 as a call for attention and a call to the United Nations to strengthen efforts to halt the planet's progressive warming trend. Three months after photographs of the Larsen B ice shelf breaking off in the Antarctic were published, an expedition financed by the United Nations Environmental Program (UNEP) has presented reports on the disappearance of glaciers in the Himalayas and the severe risks this is generating.

Coinciding with the tenth anniversary of the Rio Summit and, with it, the signing of the United Nations Framework Treaty on Climate Change, the United Nations organization has demanded new measures to increase sustainable development and to promote a new ethic in global management, within the framework of the desperation expressed by the FAO director in calling the Rome Summit a "failure in the fight against poverty", given the success of the "fight for liberty" that is led, directed and carried out by the Bush administration. Within this context, the UN clamors to recover the spirit generated in Rio 1992, now illustratively spoiled by the shackles to having the Kyoto Protocol become effective.

1.2 The Process toward Signing the United Nations Framework Treaty on Climate Change

Concern over the progressive warming of the planet was made manifest with the signing on September 16, 1987 of the Montreal Protocol, which makes reference to the policies needed in order to ban the use of substances that reduce the ozone layer, approved on September 16, 1987 in Montreal and later modified and amended.

The next year, the "Intergovernmental Panel on Climate Change" (IPCC) was constituted together with the World Meteorological Organization and the Environmental Program of the United Nations (PNUMA).

2. The United Nations Framework Treaty on Climate Change

The "United Nations Framework Treaty on Climate Change" -hereinafter called the "Treaty"- was approved in New York on May 9, 1992, and was signed by 186 countries, including the United States and the European Community, during the United Nations Conference on the Environment and Development, held in Rio de Janeiro on June 3 - 14, 1992. According to the Treaty, the signatories had to stabilize to 1990 levels the emission of greenhouse gases for 2000 that were not controlled under the Montreal Protocol of the Treaty for Protection of the Ozone Layer. The Treaty is directed mainly toward developed countries and those in transition toward a market economy, which are responsible for a large part of the emissions of gases behind the greenhouse effect.

The Treaty agreed to institute a Conference of the Parties, as a supreme organ of the Treaty, for the purpose of regularly examining the application of the Treaty and to run its legal instruments.

The Treaty instituted a financing mechanism directed toward supplying the financial resources, as subsidies or with favorable conditions in order to offer incentives for the transfer of technology to developing countries. In this sense, the Treaty established the obligation of developed countries to provide new, additional resources in order to fully cover the established expenses incurred by developing countries in transmitting information related to application of the Treaty.
This Treaty, however, turned out to be insufficient to achieve its own objectives, as clearly demonstrated by the fact that the levels of greenhouse gases in the year 2000 not only were not limited to the year 1990, but also have increased. For this reason, the Conference of the Parties to the Treaty agreed to initiate a process destined to adopting more concrete, effective measures determining the obligations of developed countries for the period following the year 2000.


3. The Kyoto Protocol of the United Nations Framework Treaty on Climate Change

This process led to approval on December 11, 1997 of the "Kyoto Protocol of the United Nations Framework Treaty on Climate Change" -hereinafter "Protocol". This is why the Protocol should be read together with that of the Treaty, due to the constant references of one to the other. Even so, it must be said that true understanding of its articles is beyond most mortals and that, in order to evaluate its effects, it is not only necessary to have it become effective sooner or later, but to have successive conferences by the parties concentrate on the slow process of limiting emissions.

On a global level, the Protocol demands that industrialized countries reduce their emissions of greenhouse gases corresponding to the year 1990 by an average of 5%, in the 2008-2012 period.

3.1 Gases, Emitting Sectors and Sources

The goal of Kyoto is to limit the emission of greenhouse gases not affected by the Montreal Protocol (gases that affect the ozone layer). In this sense, Annex A specifies the six gases specific to the greenhouse effect that are affected by the protocol: carbon dioxide (CO2), methane (CH4), nitrous oxide (N2O), hydrofluorocarbons (HFC), perfluorocarbons (PFC) and sulfur hexafluoride (SF6).

The Sectors and Categories of Sources of Emissions are:

a) The energy sector and, as categories of sources: burning of fuel (energy industries, manufacturing and construction industries, transportation and other sectors) and fugitive emissions of fuel (solids, oil, natural gas and others).
b) The industrial processing sector and, as category of sources: mineral products, chemical industry, production of metals, production and sale of halocarbons such as sulfur hexafluoride.
c) The use of solvents.
d) Agriculture and, as category of sources: enteric fermentation, making use of manure, growing rice, agricultural land, prescribed burning of savannas, burning in the fields of agricultural and other waste.
e) Waste and, as category of sources: the elimination of solid waste from soil, wastewater treatment, waste incineration and others.

3.2 Sustainable Development as Objective

The purpose of the Protocol is to promote sustainable development in a concrete way, which means reforming the current parameters of industrial countries from a strategic and transversal sector such as energy, as understood in its entire cycle of generation-distribution-consumption-recycling, and making very special reference to the need to opt for renewable sources. So questioning the current energy model not only means reforming the energy sector as such, but demanding reform in all productive sectors according to an accelerated process of technological innovation that will allow the guidelines for consumption to be varied without being lowered.

The Protocol constitutes one of the most important strategic axes leading toward new models of sustainable energy. At the same time, however, the difficulties encountered on its way to becoming effective brings up the fact that wealthy countries do not want to lose their hegemony within the perspective of sustainability, to which they are bound -on the other hand- in order to diversify the risks derived from the progressive drop in non-renewable resources such as oil, gas or coal, and the strategic dependence the control of these resources generates in a global context. So the first requirement for sustainability of the Protocol is addressed to the energy sector, by promoting greater efficiency as well as the use of new and renewable sources of energy. The second most affected sector is industry, especially that most closely related to the chemical industry. The third would be transportation, and the fourth, in order of greater to lesser generation of greenhouse gases, would be agriculture, with a specific reference to limiting emissions of methane.

Added to the reform of these productive sectors, which greatly affects wealthy countries, is the need to protect and improve the drains and greenhouse gas reservoirs which questions the practices of deforestation in poor countries and the need to reformulate practices in forestry management, forestation and reforestation.

3.3 Individual Responsibility for Each of the Parties

In order to achieve these objectives, the Protocol leaves in the hands of each country responsibility for applying fiscal and market measures to limit or reduce emissions not controlled by the Montreal Protocol. On an international level, contrarily, no common responsibility is imposed, and each of the countries that is a Party in the Protocol is exhorted to cooperate for better application of the policies derived from the Protocol and, in particular, recommendations are made to exchange experiences and information on the policies adopted.

This common responsibility, if the Protocol were in fact able to require it, would mark a trend for qualitative change in the world order in regard to sustainability. The coherence of this new global order, however, is still far from the will of the countries most involved in generating greenhouse gases, who are in the process of accepting, at most, commitments from each country -with the exception of the European Community- while leaving the establishment of a new world order at merely recommending cooperation and research as to which would be the most suitable forms of cooperation.

3.4 Limitation in Relation to Emissions in 1990

The reduction or limitation of greenhouse gases that would be involved in applying the Kyoto Protocol is expressed in more concrete terms in that, for the period between 2008 and 2012, the Parties do not generate in percentages more emissions than those listed in Annex B of the Protocol, in relation to the emissions in 1990 for each of the Parties.

ANNEX B TO THE PROTOCOL

Compromiso cuantificado de limitación o reducción de las emisiones
(% del nivel del año o período de base)

Germany 92 Iceland 110
Australia 108 Italy 92
Austria 92 Japan 94
Belgium 92 Latvia 92
Bulgaria 92 Liechtenstein 92
Canada 94 Lituania* 92
European Community 92 Luxembourg 92
Croacia* 95 Mónaco 92
Denmark 92 Norway 102
Slovakia* 100 New Zealand 102
Eslovenia* 92 Paises Bajos 92
Spain 92 Poland* 94
United States of America 93 Portugal 92
Estonia* 92 U.K. of Great Britain and Northern Ireland 92
Russian Federation* 100 Csech Republic * 92
Finland 92 Romania* 92
France 92 Sweden 92
Hungary* 92 Switzerland 92
Ireland 100 Ucraina* 100

* Países en proceso de transición hacia una economía de mercado.

In any case, it is stipulated that the reduction of global emissions must be at least 5% under 1990 levels, and that each of the Parties must be able to demonstrate by the year 2005 a concrete advance in compliance with the commitments undertaken with the Protocol.

3.5 The Peculiarity of Countries in Transition towards a Market Economy

The Parties in transition towards a market economy will nevertheless have the freedom to determine whether or not they have the intention of using a base year or period other than 1990 in order to fulfill reduction or limitation commitments. In any case, the Protocol states that the Conference of the Parties will allow for certain level of flexibility for countries in transition towards a market economy

3.6 The Difficult, Complex Evaluation of Fulfillment of Commitments

In order to fulfill the reduction or limitation commitments, the Protocol establishes that clean variations in emission sources shall be kept in mind, as shall the variation in absorption through drains of greenhouse gases deriving from changes in the use of land caused by man and forest activities -restricted since 1990 to forest repopulation, reforestation and deforestation- measured as verifiable changes in accumulations of carbon in each of the obligatory fulfillment periods.

The difficulty in measuring the absorption of gases by drains and the quantities of accumulated carbon makes it necessary to have a procedure, once the Protocol becomes effective, for a Subsidiary Body of Scientific Assessment to examine the data provided by each Party and to determine the level of carbon warehoused for 1990 and to make an estimate for the variations over the coming years.

In fact, each of the Parties is committed, before the end of the first commitment period, to approval of a national system permitting estimates to be made for man-made/anthropogenic emissions and absorption through drains. This "national system" is to be drafted in accordance with guidelines drawn up by the Conference of the Parties during their first meeting. These directives shall include methodologies for calculating emissions and drain absorption.

3.7 Transfer among Parties of Reduction Units

In article 6, the Protocol provides that any Party included in Annex I may transfer to or acquire from any other Party units for reduction of emissions deriving from projects directed towards reducing man-made emissions or to increasing absorption of the drains. This agreement of transfer or acquisition must be approved by the Parties and shall adhere to the condition that the project must involve an additional variation to any other reduction or increase, and can only be approved if each Party has approved the national system for estimating emissions and has provided supplementary information to ensure that the Party is complying with the commitments acquired through ratification of the Protocol.

3.8 Financing Commitments of Developing Countries

The Protocol reiterates the obligation stated in the Treaty that developed countries and those in transition towards a market economy provide new and additional financial resources in order to cover the needs the Protocol requires for developing countries. At the same time, they must make available resources for transferring the necessary technology to fulfill the obligations arising from the Protocol.

The financing load must be distributed in an adequate manner among the Parties that are developed countries. Even so, it is worth mentioning that the financial mechanism shall have an equitable representation that is balanced among all the Parties; however, in effect, the financing mechanism must act under the direction of the Conference of the Parties, in which each Party has a vote.

The fact that each Party has a vote remains a very significant element in a UN system that is constantly encumbered by the veto mechanism. This equality of votes among countries means that the majority of votes corresponds to poor countries (140, approximately), against the 40 developed countries, which are the ones who must take on the main obligation of limiting or reducing emissions while contributing the economic and technological funds so that the poor countries can have the means necessary to fulfill Treaty commitments. Currently, while the Protocol has not yet become effective, this proportion among countries that have ratified it is 22 (developed) to 52 (developing).

3.9 Mechanism for Clean Development

Annex I of the Protocol includes the list of developed countries taking on individual and global responsibility for greenhouse gas emissions. The mechanism for clean development is directed toward the Parties that are not included in Annex I, so that they can obtain from developed countries -Annex I- aid to achieve sustainable development by means of carrying out projects that involve certified reductions of emissions.

Unlike the obligations derived from the Treaty's general financing mechanism -which makes collaboration of developed countries obligatory- the mechanism for clean development is voluntary for the parties and, in order to motivate implementation of the mechanism, an offer is made to developed countries as incentive to have them use the certified reductions of projects they finance in developing countries to contribute to fulfilling their quantified commitments of limiting or reducing emissions.

3.10 Nonfulfillment of Protocol Commitments

"In its first period of sessions, the Conference of the Parties shall approve procedures and mechanisms that are appropriate and effective enough to deal with nonfulfillment of the provisions of the Protocol, including a list of consequences according to cause, type, severity and frequency of nonfulfillment".

This is the literal provision of Article 18 of the Protocol for cases of nonfulfillment. As may be observed, no mention is made of sanctions, and if the measures applied in case of nonfulfillment were linked, they would have to be approved as if they were an amendment to the Protocol. This acts as a shield for the Protocol against possible amendments, without them becoming impossible.

3.11 Amendments to the Protocol

Amendments to the Protocol, in theory, must be approved through a consensus of the Parties. Only if a consensus cannot be reached, and as a last resort, can the amendment be approved by a vote of 75% in favor of the voting Parties present at the meeting called for this reason. Finally, the approved amendment shall only be applied to the Parties the have approved it, and when acceptance instruments for the amendment have been received from at least 75% of the Parties to the Protocol. The amendment shall only be applicable to the rest of the Parties that do ratify it. In this sense, there is a certain shield to the Protocol, and the Parties will never be obliged to accept an amendment, which will only be applicable to them when they voluntarily ratify it.

4. Applying the Protocol to the European Union

Through application of the Protocol, the European Union is committed to reducing by 8% its greenhouse gas emissions from 1990 as a whole, in the 2008-2012 period.

The objectives of limiting greenhouse gas emissions in the European Union and its member states were approved in a legal, obligatory sense on March 4, 2002 in the European Union's Council of Ministries of the Environment. The objectives of reduction for each country are those politically agreed upon in the month of June of 1998. This commitment is legally stated as Annex II of Council Decision 2002/358/EC.

The objectives for limiting/reducing greenhouse gases in the Nations of the European Community are as follows:

Austria
-13%
European Community
-8%
Belgium
-75%
Italy
-6,5%
Denmark
-21%
Luxembourg
-28%
Finland
0%
Holland
-6%
France
0%
Portugal
+27%
Germany
-21%
Sapin
+15%
Greece
+25%
Sweden
-4%
Ireland
-13%
United Kingdom
-12,5%

In accordance with this last decision, the European Community and its member states have also agreed to simultaneously deposit their ratification instruments with the United Nations before June 1, 2002.

5. Ratification of the Protocol by the European Union

On April 25, 2002, the Council of the European Unions, on behalf of the European Community, adopted Decision 2002/358/EC (OJEC L 130 dated 15.5.2002) approving the Protocol that had been previously signed in New York on April 29, 1998.

Later, the European Union ratified the Kyoto Protocol on May 31, 2002. This action has reaffirmed the commitment of the European Union and its member states to the search for multilateral solutions to the general problem. The intention of the ratification is to realize the ambition of the European Union of having the Protocol become effective before the World Summit on Sustainable Development to be held in Johannesburg in August-September of this year. In this sense, the European Union has repeatedly invited other Parties to ratify the Protocol as soon as possible, and continues to urge the US to participate in the global framework to redress climate change.

By deciding to fulfill the Kyoto commitments together, the European Community and its member states take on individual and collective co-responsibility to take the appropriate general or specific measures to ensure fulfillment of the obligations arising from actions on the part of Community institutions, including the quantified commitment to emissions reductions.

With this community ratification, it may be stated that the Kyoto commitments are being fulfilled if, as a whole, the European Community reduces its emissions by 8%, even though some community nation may not comply with its specific commitment. Contrarily, if the European Community as a whole does not fulfill its global reduction objective, each of the Parties is responsible for the level of its emissions and the fulfillment of its own objectives.

This reinforces the European will to comply with the Protocol commitments, and the Community itself has taken on competence that is highly significant, allowing it to have an instrument with which it can make member states fulfill commitments related to the Protocol. This assuming of competence on the part of the European Community will allow the Committee to be able to agree upon necessary measures for executing Decision 2002/358/EC. This taking on of functions is confirmed when the Decision makes clear that the Committee itself, before December 31, 2006, shall determine the levels of emissions attributed to the European Community and to each of the member states, in tons equivalent of carbon dioxide.

In fact, as stated in Decision 2002/358/EC: "annual reference emissions for the Community and its member states shall not be definitely determined until the Protocol has become effective. Once these annual reference emissions have been set and, at most, before the beginning of the period of commitment, the Community and its member states shall determine the levels of emission in equivalent tons of carbon dioxide".

The limitations or reductions in emission levels stated in Annex II of the Decision are those that were politically agreed upon in June, 1998. With this community Decision and the respective ratifications of the Protocol by member states, the commitment to limitation has left off being a political agreement to become a legal obligation.

The European Commissioner of the Environment, Margot Wallström, called this European ratification of the Protocol an historic moment in the continued global effort to combat the change, and stated:

" Scientific evidence of the climate change is stronger than ever. We know that the goals of Kyoto are only the first step in the process of avoiding the serious consequences that climate change can bring. All countries must act, but industrialized countries must take the initiative. Climate change can only be fought within the framework of a multilateral process. The battle against climate change is vital to achieving sustainable development. I am convinced that improving the environment through technological progress can improve our current competitiveness and economic growth. This is what sustainable development means: to protect our ecosystem while ensuring economic prosperity."

6 The Protocol Becoming Effective

6.1 Conditions

The challenge of having the Protocol become effective is closer today than ever. Even when it does go into effect, as prescribed by Article 25 of the Protocol, it will still need to be ratified by a minimum of 55 signing States who, furthermore, must be responsible for at least 55% of the emissions of greenhouse gases corresponding to 1990.

The total emissions of carbon dioxide for the year 1990 that must be taken into account in applying Art. 25 are those detailed in the following table:


KYOTO PROTOCOL
Total emissions of carbon dioxide of the Parties to the Annex of the year 1990,
in applying Article 25 of the Kyoto Protocolª

Parte Emisiones (Gg) Porcentaje
Austria
59.200
0,4
Belgium
113.405
0,8
Bulgaria
82.990
0,6
Canada
457.441
3,3
Czech Republic
169.514
1,2
Denmark
52.100
0,4
Australia
288.965
2,1
Estonia
37.797
0,3
Finland
53.900
0,4
France
366.536
2,7
Germany
1.012.443
7,4
Greece
82.100
0,6
Hungary
71.673
0,5
Iceland
2.172
0,0
Ireland
30.719
0,2
Italy
428.941
3,1
Japan
1.173.360
8,5
Latvia
22.976
0,2
Liechtenstein
208
0,0
Luxemboug
11.343
0,1
Monaco
71
0,0
Holland
167.600
1,2
New Zealand
25.530
0,2
Norway
35.533
0,3
Poland
414.930
3,0
Portugal
42.148
0,3
Romania
171.103
1,2
Russian Federation
2.388.720
17,4
Slovakia
58.278
0,4
Spain
260.654
1,9
Sweden
61.256
0,4
Switzerland
43.600
0,3
U.K.of Great Britain and Northern Ireland
584.078
4,3
United States of America
4.957.022
36,1
Total
13.728.306
100,0

6.2 Reticence in Ratifying the Protocol

The objective of the European Union and, in general, of the UN was to have the Protocol become effective during the Earth Summit of Johannesburg, to be held this August and September. However, opposition, mainly from the US, and reticence on the part of Canada and Australia -the largest exporter of coal- make it difficult to have this goal achieved.
The US has the heaviest greenhouse gas emissions, with one of the highest levels of emissions per capita and, upon signing the Protocol, it was committed to reducing emissions by 7% in reference to those of 1990. Even so, President Bush said that the US will not ratify the Kyoto Protocol, while announcing on February 14th an internal policy that means an increase of 30-40% of the emissions from 1990 for the year 2010. The European Union and many other nations have made repeated calls to have the US return to the multilateral process for redressing climate change.

7. The Slow Trend towards Ratification

Nevertheless, on June 4, 2002, the Bush administration acknowledged for the first time that greenhouse gas emissions by the US will significantly increase over the next two decades due to human activity. Even so, once more it has rejected an international treaty to slow global warming. A report published without much fanfare in early June by the EPA gave surprising support to what scientists have been saying for a long time: that oil refineries, energy plants and automobile emissions are the main causes of global warming. The gradual increase in temperatures is most likely threatening coastal islands and alpine fields. The White House had defended itself earlier by citing a lack of sufficient evidence relating industrial emissions to global warming. The EPA report states that greenhouse gases are accumulating in the Earth's atmosphere as a result of human activity, causing an increase in average temperatures on the surface of the Earth and in temperatures in the depths of the oceans. This position has placed the administration against its US supporters: automobile, gasoline and electricity industries. All of these sectors defended the need for further research in order to confirm if the changes were due to natural causes or, contrarily, to industry.

The forecast for greenhouse gas emissions in the US to increase in 2020 by 43% makes the challenge set forth by applying the Protocol unreachable. Even so, the spirit of Kyoto is slowly gaining ground. Earlier, a few days after ratification by the European Community, on the 4th, Japan ratified the Protocol. With this latest inclusion, the Protocol's ratification thermometer (http://unfcc.int/resource/kpthermo.html) indicated that 22 developed countries and 52 developing countries had already ratified it, making a total of 74, enough in number for the Protocol to become effective, but insufficient in regard to total emissions. The 74 ratifying countries are only responsible for 35.8% of emissions, a figure that is less than the 55% required for the Protocol to become effective.

Given the strong resistance by the US, expectations are placed with a possible ratification by the Russian Federation which, with 17.4% of emissions, would make the thermometer rise to 53.2%, a figure that is very close to the required 55% minimum, thereby making later ratification possible by Switzerland (0.3%) or Bulgaria (0.6%), or countries from the old Czech Republic (1.2%), or Estonia (0.3%), or Latvia (0.2%) or New Zealand (0.2%) contributing to reach 55% without having the US ratify it.

The Earth Summit of Johannesburg will become a reference point in this slow but inevitable process towards signing the Protocol or, if you will, in this slow and still inexorable process of increased greenhouse gas emissions.


Discussion forum
 

Medi Ambient. Tecnologia i Cultura no s'identifica necessàriament amb l'opinió que expressen els articles signats
© Departament de Medi Ambient de la Generalitat de Catalunya
DL: B-44071-91
ISSN:  1130-4022