“Volunteers for language”, Linguistic Integration Programme in Catalan: facts for evaluation, by Joan Solé Camardons, Jonatan Castaño and Agustí Díaz |
||||
| CONTINUA |
The definition that was established on degree of success or failure in the case of each variable was:
Apart from growth of these two variables and their scores (speaking ability and use of Catalan) and the degree of success or otherwise (S, N, F) a technical typology was devised, as shown in the next table: Taula 2. Technical typology of learners with regard to ability and frequency of use of Catalan (7)
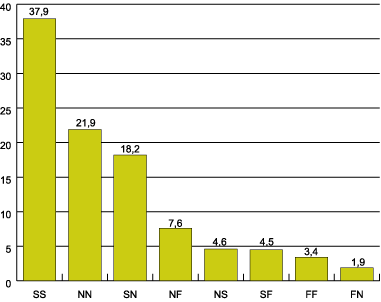
From this theoretical combination of 9 types of learners are derived the 8 types that we find in practice, given that no learner who answered the questionnaire fell into the category FS, that is, they failed to increase ability to speak Catalan, but increased use of Catalan compared with use before beginning programme. According to the results of the questionnaire, the distribution of learners expressed in percentages was as follows: Graph 1. Groups of learners. Percentage of types of learners
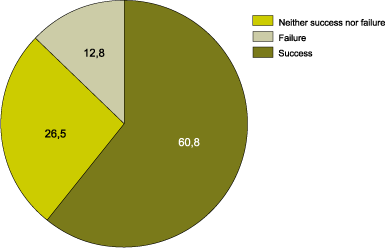
As is shown on graph 1 there are three groups of learners classified as “successful” (SS, SN and NS), two groups we classify as “neither successful nor failures” (NN, SF), and three groups classified as “failures” (NF, FF and FN). Lastly, if we group the groups by success and failure gradients, we get the following: 60.8% of the learners had increased greatly or considerably their speaking abilityand / or effective use (“successful learners”); 26.5% had increased ability andactual use ofCatalan slightly; that is, we could class them as “neither successes nor failures”, and 12.8% had not increased ability in or use of Catalan (“failures”). Graph 2. Type of learners in terms of success or failure
4.2 Investigation of the variables that affect success To ascertain the factors that have a bearing on success a technique known as C&RT was used (8). This consists in finding the main variables that will explain success or failure. This method selects hierarchically those variables that can best explain the main variable. In this case two segmentation trees where drawn up, serving to isolate, and defined the variables in an exploratory way. In segmentation tree 1 (PDF 82 KB) the following variables have been taken into account: (9)
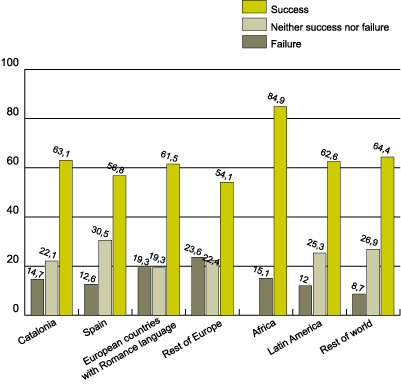
In segmentation tree 2 (PDF 75 KB) the same variables are there, except that the most influential variable of them all from tree 1 (knowing how to speak Catalan) has been excluded, in order to be able to tell which variables have the most influence on successful and unsuccessful outcomes. If we analyse the two trees from a collective or conjoined viewpoint we will observe the fact that having some minimal notions of Catalan is the variable having most influence on success or failure, followed by the number of sessions or hours devoted to a programme. In the second place we see that a specific employment situation and the fact of having attended or not attended a course on Catalan for adults also has an influence of results. These two variables and the number of hours put in, all point to the concept of time available for the programme, and the language habitually spoken, as the cluster of variables that best explain (or predict) success. 4.3 Characteristics of the groups of learners Below we will look at the characteristics of these three groups in terms of the set variables or factors having a bearing on success or failure: the three socio-demographic variables (place of birth, age and state of employment) and the two sociolinguistic variables (able or not able to speak Catalan at the outset, and the language habitually spoken) and two variables having to do with the programme (number of hoursand level of attendance of the courses). Place of birth Here, what is most noticeable is that those born in Africa are the group with the highest level of success (85%), those born in Spain outside Catalonia present the highest percentage of “neither success nor failure” with 30.5%. The group born in Latin America are two tenths above average (62.8%) in terms of success, while those born in the rest of Europe are the group with the lowest percentage of success at 54%. Graph 3. Place of birth and learner type
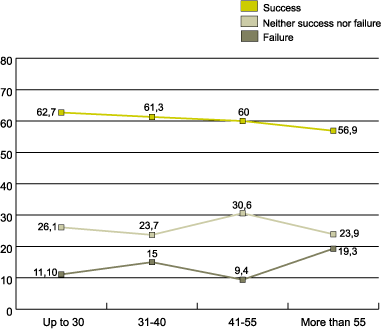
Age group Turning to age group and type of learner (degree of success), we see a difference of 6 percentage points between the under 30s group and the over 55s group. In achieving success, so we can state that the younger group have a slight advantage with respect to the oldest age group. This tendency is not so clear with the “failure” category, nor with the “neither success nor failure” category. With the 41 to 55 age group, there is a lower percentage of failure, but with a higher percentage in the intermediate category. Graph 4. Type of learners by age group
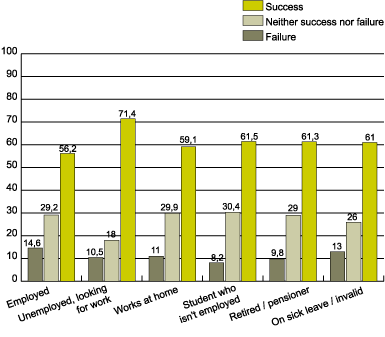
Employment situation With respect to learners’ employment situation, the unemployed looking for work are those with the greatest success in the programme, while those in employment and those who work at home are the two groups with the lowest success level. There may be two reasons for this: on the one hand, we see that those with least free time have the least success; on the other hand, those who are out of work and looking for work and looking for work not only have more time, but are more successful as a result of instrumental motivation, since being able to speak Catalan will open more doors on the labour market. Graph 5. State of employment and success achieved
|
|||||||||||||||||||||
